Allison B. Haugrud, Yongxian Zhuang, Joseph D. Coppock, W. Keith Miskimins
Cancer Biology Research Center, Sanford Research, 2301 E. 60th St North, Sioux Falls, SD 57104, USA
e-mail: [email protected]
Received: 24 April 2014
Accepted: 5 September 2014
Published: 12 September 2014
Abstract
The unique metabolism of breast cancer cells provides interest in exploiting this phenomenon therapeutically. Metformin, a promising breast cancer therapeutic, targets complex I of the electron transport chain leading to an accumulation of reactive oxygen species (ROS) that eventually lead to cell death. Inhibition of complex I leads to lactate production, a metabolic byproduct already highly produced by reprogrammed cancer cells and associated with a poor prognosis. While metformin remains a promising cancer therapeutic, we sought a complementary agent to increase apoptotic promoting effects of metformin while attenuating lactate production possibly leading to greatly improved efficacy. Dichloroacetate (DCA) is a well-established drug used in the treatment of lactic acidosis which functions through inhibition of pyruvate dehydrogenase kinase (PDK) promoting mitochondrial metabolism. Our purpose was to examine the synergy and mechanisms by which these two drugs kill breast cancer cells. Cell lines were subjected to the indicated treatments and analyzed for cell death and various aspects of metabolism. Cell death and ROS production were analyzed using flow cytometry, Western blot analysis, and cell counting methods. Images of cells were taken with phase contrast microscopy or confocal microscopy. Metabolism of cells was analyzed using the Seahorse XF24 analyzer, lactate assays, and pH analysis. We show that when DCA and metformin are used in combination, synergistic induction of apoptosis of breast cancer cells occurs. Metformin-induced oxidative damage is enhanced by DCA through PDK1 inhibition which also diminishes metformin promoted lactate production. We demonstrate that DCA and metformin combine to synergistically induce caspase-dependent apoptosis involving oxidative damage with simultaneous attenuation of metformin promoted lactate production. Innovative combinations such as metformin and DCA show promise in expanding breast cancer therapies.
Keywords: Metformin; Dichloroacetate; Breast cancer; Lactate; Apoptosis
© Springer Science+Business Media New York 2014
INTRODUCTION
Cancer metabolism is a developing into a promising area for development of new therapeutic approaches. Compared to the normal cells from which they derive, cancer cells are metabolically reprogrammed, preferentially utilizing glycolysis even under conditions of sufficient oxygen, a phenomenon known as the Warburg effect [1]. To compensate for lost ATP as a result of preferential glycolysis (vs. progression through oxidative phosphorylation), cancer cells up-regulate genes encoding glucose transporters and glycolytic enzymes such as pyruvate dehydrogenase kinase (PDK) and lactate dehydrogenase (LDH). This high rate of glucose uptake and altered metabolism not only provides ATP and allows cells to survive under hypoxic conditions; it also provides biosynthetic building blocks such as intermediates and substrates for the production of amino acids, NADPH, and ribose-5-phosphate which are essential for nucleotide, protein, and membrane synthesis necessary in rapidly dividing cells. This also means the mitochondrial TCA cycle generates a lower percentage of ATP, allowing citrate to be used in fatty acid and lipid biosynthesis for the production of new membranes [2]. Much of the glycolysis-derived lactate is taken up by surrounding cells with reciprocal recycling to support the growth of the tumor and resistance to apoptotic cell death mechanisms [2, 3]. Lactate produced by tumors can disrupt T cell metabolism and antigen presentation of dendritic cells, which leads to immune evasion for the tumor [4, 5]. Thus, the high levels of glucose usage and glycolysis provide cancer cells numerous advantages. However, it may also be possible to exploit cancer’s unique metabolic profile therapeutically. In this study, we examined the activity and interplay of two metabolism targeted drugs, metformin and dichloroacetate (DCA), to determine their effects on growth and survival of breast cancer cells.
Metformin hydrochloride (1,1-dimethylbiguanide hydrochloride) is an oral drug widely used in the treatment of type two diabetes. Studies have shown that diabetic patients on metformin have a lower incidence of cancer and related deaths than patients not on metformin. In one such study, diabetic breast cancer patients on metformin had a significantly better response to neoadjuvant chemotherapy compared to patients not on metformin [6–8]. In vitro studies have concluded that metformin inhibits growth of many types of cancer cells including those from breast cancer, colon cancer, prostate cancer, ovarian cancer, and gliomas [9–12]. Metformin is known to activate AMP-activated protein kinase (AMPK) which leads to inhibition of protein synthesis and cell growth [13]. However, activation of AMPK alone is not enough to lead to apoptotic cell death [14]. Studies have shown that metformin accumulates in the mitochondria and mildly inhibits complex I of the electron transport chain, an event that takes place upstream of AMPK activation [15–18]. As complex I is inhibited, impeded electron passage leads to superoxide production within the mitochondrial matrix, damaging mitochondrial proteins, lipids, and nucleic acids. In studies in which metformin has been shown to promote cell death, apoptosis is the main pathway [10, 12, 19]. We have previously shown that metformin induces both caspase-dependent and poly(ADP-ribose) polymerase (PARP)-dependent cell death in most breast cancer cell lines while being non-cytotoxic to non-transformed breast epithelial cells [20]. Poly(ADP-ribose) polymerase-dependent cell death was associated with major alterations in mitochondrial shape and function, leading to the conclusion that mitochondrial damage in cancer cells is a key mediator of metformin-induced cell death. Based on these observations, we hypothesized that compounds that promote mitochondrial oxidative metabolism would enhance metformin-induced mitochondrial damage and synergize with metformin in killing cancer cells. As metformin treatment also promotes production of lactate [21], such a compound would ideally also combat this effect.
Dichloroacetate is also an orally available drug with well-studied pharmacokinetics and has been tested for the treatment of lactic acidosis (a potential side effect of metformin) and mitochondrial deficiencies [27]. Dichloroacetate is an inhibitor of PDK which phosphorylates pyruvate dehydrogenase (PDH), rendering it inactive [23]. Pyruvate dehydrogenase is the enzyme responsible for catalyzing the transformation of pyruvate to acetyl-CoA for entry into the mitochondrial tricarboxylic acid (TCA) cycle and oxidative phosphorylation. In cancer cells, PDK activity is often elevated, acting as a gatekeeper to reduce the flux of pyruvate from the cytoplasm into mitochondria metabolism. This is thought to be an important component of metabolic reprogramming in cancer cells, leading to reduced glucose oxidation and the production of lactate [24–26]. By inhibiting PDK, DCA enhances PDH activity, allowing pyruvate to enter the TCA cycle rather than being converted to lactate and secreted [27].
In this study, we examined the antitumor activity and interplay of two metabolism targeting drugs, metformin and DCA. We show that DCA enhances the cytotoxicity of metformin to breast cancer cells through a mechanism involving oxidative damage while simultaneously lowering lactate production by metformin, potentially providing a dual therapeutic advantage.
Methods
Chemicals and reagents
The following chemicals, reagents, and kits were purchased through Sigma-Aldrich unless otherwise noted: metformin (1,1-dimethylbiguanide), sodium dichloroacetate, 0.4 % trypan blue solution, Vectashield mounting medium for fluorescence containing 4,6 diamidino-2-phenylindole (DAPI) (Vector Laboratories), Lactate Assay Kit (Eton Biosciences), caspase inhibitor OPH-109 (MP Biomedicals), Coomassie Brilliant Blue R250 (Bio-Rad Laboratories), paraformaldehyde, SYTOX® Green (Life Technologies), Triton X-100 (Eastman), and PARP inhibitor II INH2BP (Epigentek).
Cell culture
MCF7 and T47D human breast cancer cell lines and MCF10A human mammary epithelial cells were purchased from ATCC. The 66CL4 mouse mammary carcinoma cell line was provided by Dr. Fred Miller (Karmanos Cancer Institute, Detroit, MI). Upon receiving the cells lines, cells were immediately cultured and expanded to prepare frozen ampule stocks. Cells were passaged for no more that 2–3 months before establishing new cultures from the early passage frozen ampules. Cell lines were routinely checked for mycoplasma contamination and were verified to be mycoplasma free by IDEXX RADIL Laboratories. Cells were maintained in Dulbecco’s modified Eagle’s medium (DMEM) with 10 % fetal bovine serum, 100 U/ml penicillin, and 100 µg/ml streptomycin. Cells were incubated in a humidified CO2 incubator at 37 °C.
Trypan blue exclusion assay
MCF7 and T47D cell lines were plated on 35 mm dishes. Cells were treated with metformin and DCA at the indicated concentrations or with vehicle. After the indicated time period, medium was collected to save any floating dead cells. Attached cells were washed with phosphate buffered saline (PBS), which was pooled with the collected media. Cells were then harvested by trypsinization and added to the pool. Trypan blue solution was then used to stain dead cells 1:1, and cells were counted via hemacytometer.
Western blotting
Cells were plated on 35 mm dishes. After treatment for the indicated time period, cells were harvested in the medium to collect live and dead cells. Cells were pelleted, washed with PBS, and re-pelleted. The cell pellet was then lysed by addition of 1× sodium dodecylsulfate (SDS) sample buffer [2.5 mM Tris–HCl (pH 6.8), 2.5 % SDS, 100 mM dithiothreitol, 10 % glycerol, 0.025 % bromophenol blue]. Equal amounts of protein were separated on an 8.5 % SDS–polyacrylamide gel. Proteins were transferred to Immobilon P membranes (Millipore) with a Bio-Rad Trans-blot apparatus using a transfer buffer [48 mM Tris–HCl, 39 mM glycine]. The membranes were immersed in 5 % non-fat dry milk in Tris-buffered saline containing Tween 20 (TBS-T) [10 mM Tris–HCl (pH 7.5), 150 mM NaCl, 0.1 % Tween-20] with the indicated antibody for either 3 h at room temperature or 4 °C overnight. After thoroughly washing with TBS-T, an appropriate secondary antibody conjugated to horseradish peroxidase (HRP) was applied. The membrane was again washed, and proteins were then detected using Super Signal West Pico chemiluminescent substrate (Pierce Biochemical). For the isolation of mitochondria, (Fig. 3d) MCF7 cells were grown to 95 % confluence on 150 mm dishes. A Mitochondrial Isolation Kit for Cultured Cells (Pierce) was used to isolate mitochondria according to the manufacturer’s protocol. All blots were imaged using a UVP imaging system. The following antibodies were used: Pyruvate dehydrogenase kinase1 (Abcam), PARP (Cell Signaling), anti-4-hydroxynonenal (Millipore), Complex I subunit NDUFB8 (Mitosciences), GAPDH (Ambion), PDH (Abcam), and Phospho-PDHE1 alpha (Calbiochem).
Confocal microscopy
Cells were plated on glass cover slips in 35 mm dishes and treated as indicated. Cells were washed in PBS, fixed with 4 % paraformaldehyde for 10 min, mounted in Vectashield medium with DAPI on standard microscope slides and then observed on an Olympus FV1000 confocal microscope at 100×. Establishment of MCF7 stably expressing pAcGFP1-Mito (Clontech; a plasmid encoding mitochondrial targeted fluorescent proteins) cell lines were described previously [20].
Lactate assay and pH analysis
MCF7 and 66CL4 cells in 35 mm dishes were grown to 80 % confluence and treated as indicated in phenol red free, carbonate free media. Cells were treated for 4–6 h. Medium from the dishes was collected and lactate concentration measured using a commercially available L-Lactate Assay Kit (Eton Bioscience). For the 66Cl4 cell line, cells were counted by hemacytometer for normalization of lactate levels. pH meter was used to measure media pH.
Colony forming assay
MCF7 cells were plated at 500 cells per 60 mm dish. The following day cells were treated as indicated. After 12 days of incubation, cells were washed with PBS and fixed with 70 % ethanol for 5 min. Colonies were then stained with Coomassie Blue [40 % methanol, 12 % glacial acetic acid, 0.24 % Coomassie Blue], washed, imaged, and quantified using an AlphaImager System and corresponding image analysis software (AlphaInnotech, Santa Clara, CA).
Flow cytometry
MCF7 cells were treated as indicated. Cells were then incubated with MitoSOX (5 µM) for 15 min, washed, trypsinized, and 1 ml 10 % FBS DMEM was added to the cells. Detection of MitoSOX levels within an equal number of cells per treatment condition was determined by flow cytometry using an Accuri C6 cytometer.
Inhibition of PDK1 using an siRNA
On-TARGET Plus Smartpool siRNA targeting PDK1 and non-targeting siRNA were purchased from Thermo Scientific. 66CL4 cells (250,000/dish) were plated on 35 mm dishes. The following day, the cells were transfected with the siRNAs using Dharmafect (Thermo Scientific) according to the manufacturer’s protocol. The transfection was repeated the following day. The subsequent day, cells were washed and treated as indicated in carbonate free DMEM with 10 % FBS. After 4 h, cells were counted using the hemacytometer, and media was collected for measurement of pH and lactate levels. Cells were collected for analysis of PDK1 levels by western blotting.
Thiobarbituric acid reactive substances (TBARS) assay
MCF7 cells were grown to 100 % confluence on 150 mm dishes. Cells were treated as indicated for 24 h with metformin (8 mM) or DCA (5 mM). Cells were harvested in PBS, sonicated, and relative protein values were determined using the Bradford Assay. Lysates were processed using the Quantichrom™ TBARS Assay Kit and read on a SpectraMax M5 plate reader (λ ex/em = 560 nm/585 nm).
SYTOX® green assay
MCF7 and T47D cells were plated on 96-well plates and grown to 90 % confluence. Cells were treated as indicated followed by the addition of SYTOX® Green nucleic acid stain (10 µM) and incubation for 20 min before reading on a fluorescence plate reader at an λ ex/em = 485/535 nm with a 515 nm cutoff. Cells were then permeabilized with Triton X-100 (0.4 %) for 30 min, and a second reading was acquired to determine total level of DNA staining, a surrogate of total cell number. Combination index values were determined using CalcuSyn software.
Oxygen consumption rate
Oxygen consumption rate (OCR) was measured using a Seahorse XF24 analyzer according to the manufacturer’s instructions (Seahorse Bioscience, North Billerica, MA, USA). T47D cells were plated at 40,000 cells/well in XF24-well plates. The next day, cells were washed and equilibrated with buffer free media for 30 min at 37 °C in a CO2-free incubator before transfer to the XF24 analyzer. An initial measurement of OCR was obtained followed by addition of DCA via injection ports into the wells to a final concentration of 5 mM. OCR was measured every 30 min.
Statistical analysis
Comparison of two groups was done using unpaired t test with Welch’s correction generated in Graph Pad Prism software (La Jolla, CA). P values less than or equal to 0.05 were considered to have significance.
Results
DCA and metformin synergistically induce apoptosis in breast cancer cells
We have previously shown that metformin induces two distinct types of cell death after 3 days of treatment in most breast cancer cell lines, while being non-cytotoxic to normal mammary epithelial cells [20]. Induction of cell death in breast cancer cells was closely associated with altered mitochondrial structure, suggesting that metformin, a known inhibitor of Complex I of the mitochondrial electron transport chain, kills cancer cells by altering mitochondrial function. This led us to hypothesize that increasing mitochondrial electron transport would enhance metformin-induced cancer cell death. As DCA promotes mitochondrial oxidation of pyruvate, we first examined whether DCA could enhance metformin-induced cytotoxicity in breast cancer cell lines.
MCF7 and T47D breast cancer cells were treated with metformin, DCA, or their combination. The concentration of metformin used was 8 mM which represents a physiologically relevant dose of metformin, as shown by the work of Owen et al. [17]. As for DCA, low millimolar concentrations can be achieved in patient serum thus the 0.5–5 mM range is clinically relevant [27–29] and was used in these experiments. Live and dead cell numbers were determined by trypan blue exclusion assay (Fig. 1a). Cell death was measured in MCF7 cells (Fig. 1a left) treated for 2 days, and T47D cells (Fig. 1a right) were treated for 4 days. In both cell lines, metformin induced cell death as observed in previous experiments [20]. However, cell death was significantly increased by concurrent treatment with DCA and metformin, while DCA alone had minimal cytotoxic effects (Fig. 1a). When MCF10A non-transformed breast epithelial cells were subj#20ected to the same treatments, cell death was not observed as shown in Fig. 1b. To explore this observation of cell death in cancer cells further, dose titrations and SYTOX Green cytotoxicity assays were performed (Fig. 1c). The drug combination was tested for synergy by the method of Chou [30] using CalcuSYN software which generates a combination index (CI) of the drugs; from which synergy is indicated if the CI is less than 1. MCF7 cells (Fig. 1c left) had a CI of 0.00047 when treated for two days with the combination of DCA and metformin. T47D cells had a CI of 9.762e-006 after 4 days of treatment (Fig. 1c right). These values indicate strong synergistic cytotoxicity with the combination of DCA and metformin in these breast cancer cell lines.
Next the observed cytotoxic effects of DCA (2.5 mM) and metformin (1 mM) were validated using colony forming assays. At these concentrations both drugs alone reduced colony size but did not significantly reduce colony number (Fig. 1d, e). However, a significant decrease in the number of colonies was observed when the two drugs were combined (Fig. 1e). These observations demonstrate that DCA enhances metformin-induced cytotoxicity in breast cancer cells compared to either drug alone.
DCA promotes oxidative phosphorylation through inhibition of PDK1 and attenuates metformin-induced lactate production
To confirm that the observed effects of DCA are due to inhibition of the expected target, PDK1, we show that DCA does indeed decrease the levels of phosphorylated PDH compared to control in MCF7 and MCF10A cells by western blot (Fig. 2a). Stimulation of pyruvate dehydrogenase following DCA treatment is expected to enhance oxidative metabolism of pyruvate. This effect was studied using a Seahorse XF24 analyzer. The OCRs of control versus DCA-treated MCF7 cells were measured (Fig. 2b). Dichloroacetate-treated cells had a significantly higher OCR compared to control cells.
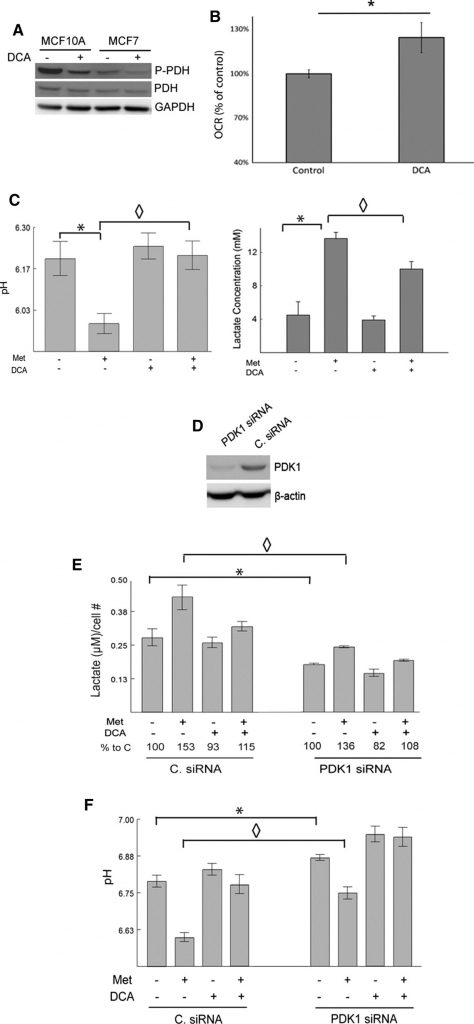
Metformin, as a mild inhibitor of complex I and an enhancer of AMPK activity, is expected to stimulate glycolytic rates and increase lactate production [11,14,15,17]. In contrast, DCA is expected to redirect pyruvate to mitochondrial metabolism at the expense of lactate production. To examine this, pH and lactate levels in the media of cultured MCF7 cells were measured following treatment with metformin, DCA, or both. Metformin-treated cells produced significantly higher levels of lactate compared to untreated controls. Dichloroacetate alone had small effects but significantly decreased metformin-induced lactate production. The pH of the media corresponded with the observed changes in lactate levels (Fig. 2c). That is, metformin significantly reduced medium pH and this effect was largely eliminated by DCA.
To further substantiate the role of PDK in lactate production and inhibiting the entry of pyruvate into the TCA cycle, PDK was knocked down using siRNA in 66CL4 cells. This cell line is derived from a mouse mammary carcinoma and may be useful for translating these experiments into a preclinical setting in future studies. The cells were transfected with either siRNA that targets PDK1 (PDK1siRNA) or a non-targeting control siRNA (C. siRNA). PDK1 levels were detected via western blot, and PDK1 siRNA transfected cells had noticeably lower levels of PDK1 compared to the C. siRNA transfected cells (Fig. 2d). SiRNA-mediated repression of PDK1 reduced lactate production and increased medium pH, consistent with the known functions of PDK1 (Fig. 2e, f). PDK1 knockdown effectively decreased metformin-induced changes in lactate and medium pH. Dichloroacetate further decreased lactate and increased pH in the PDK1 siRNA transfected cells. The ability of DCA to reverse the effects of metformin on lactate and pH was somewhat blunted when PDK1 was knocked down, again suggesting that DCA is mediating its effects through PDK1. In sum, it can be concluded that loss of PDK1 by either siRNA transfection or inhibition by DCA prevents metformin-induced lactate production.
DCA in combination with metformin enhances oxidative damage and subsequent caspase-dependent cell death
Metformin inhibits complex I of the electron transport chain, impeding flow of electrons and leading to the production of superoxide within the mitochondrial matrix. As DCA promotes pyruvate entry into the TCA cycle, we hypothesized that DCA could enhance ROS production as a potential mechanism of its cytotoxic synergy with metformin. MitoSOX, a specific indicator of mitochondrial superoxide production, stained cells which were analyzed by flow cytometry. After 1 h of treatment, neither metformin (red line Fig. 3a left panel) nor DCA (not shown) enhanced mitochondrial superoxide production. However, combined treatment with both DCA and metformin produced a right shift in fluorescence intensity, indicating increased superoxide production. After 3 h of treatment, metformin-treated cells began to produce increased levels of mitochondrial superoxide metformin (red line Fig. 3a right panel) compared to untreated cells (black line). Combining DCA and metformin showed even greater levels of superoxide staining. These results indicate metformin interferes with electron transport in complex I, leading to increased superoxide production, and that DCA potentiates the effect of metformin.
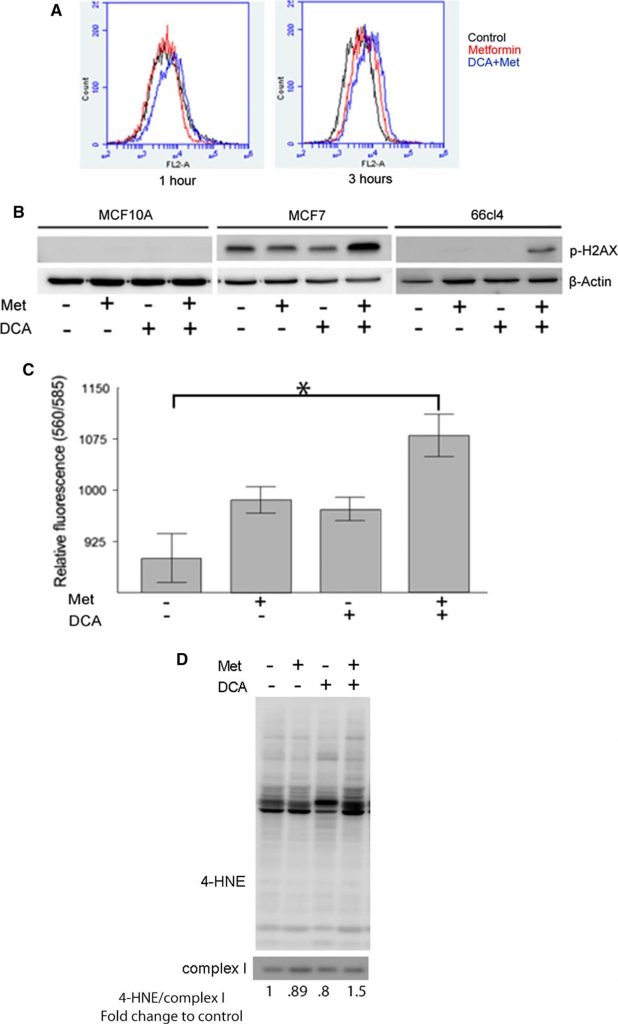
Accumulation of superoxide and other ROS has the potential to damage cellular components, including proteins, membranes, and DNA. Oxidative damage to DNA can lead to double strand breaks and phosphorylation of histone H2AX (p-H2AX), which is a useful surrogate marker of such DNA damage [31]. Therefore, to estimate DNA damage associated with ROS production in response to metformin and DCA treatment, the levels of phosphorylated H2AX can be analyzed. Human mammary epithelial MCF10A and breast cancer cell lines MCF7 and 66CL4 were analyzed by western blotting after treatment with DCA, metformin, or their combination for 24 h (Fig. 3b). In MCF10A cells, no detectable amounts of p-H2AX were observed with any treatment. In MCF7 cells, p-H2AX was present in untreated cells and was considerably increased by the combination of metformin and DCA but not by either drug alone. In 66CL4 cells, p-H2AX was only observed in DCA plus metformin co-treated cells. These data suggest that DCA and metformin combined to enhance oxidative damage to DNA.
As a second level of evidence, we measured lipid peroxidation which occurs when free radicals damage lipids in cell membranes. Two separate methods were used to estimate the extent of lipid oxidation following treatment with DCA and metformin. First, the TBARS assay which measures byproducts of lipid peroxidation and is used to evaluate the extent of oxidative damage of cellular membranes caused by ROS. TBARS increased in MCF7 cells treated with either metformin or DCA alone, and the greatest increase was observed when both drugs were combined (Fig. 3c). The second method used to estimate lipid oxidation was a western blot of 4-hydroxynonenol (4-HNE) protein adducts which are derived from the oxidation of unsaturated fatty acids in cellular membranes and forms covalent adducts with proteins, providing an indication oxidative damage to cellular membranes. MCF7 mitochondrial extracts from cells treated with DCA, metformin, or both for 24 h were analyzed for 4-HNE protein adduct levels (Fig. 3d). Increased levels of mitochondrial 4-HNE adducts were observed only in cells treated with the combination of metformin and DCA. This supports the previous results that the combination of these drugs causes an increased production of ROS.
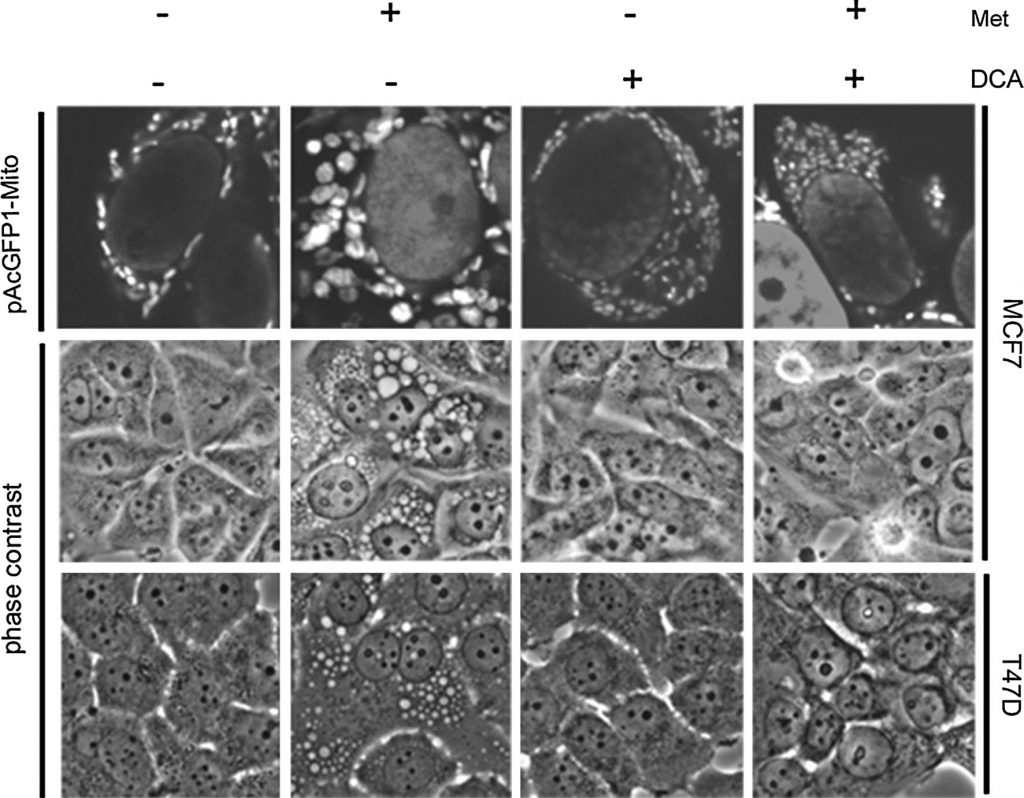
Our past data shows that metformin sensitive cells develop large vacuoles which were determined by imaging GFP-linked mitochondria and by electron microscopy to be structurally altered mitochondria. These altered mitochondria appear to be specifically related to a PARP-dependent cell death pathway that is delayed in time relative to apoptotic cell death [20]. Since DCA synergizes with metformin in cell death, the effects of DCA on mitochondrial structure were investigated. A stable MCF7 cell line expressing a green fluorescent protein targeted to mitochondria (pAcGFP1-Mito) was developed. Cells were treated for one day before imaging by phase contrast and confocal microscopy (Fig. 4). In cells treated with metformin alone, large mitochondria were observed, as seen previously [20]. In stark contrast, DCA-treated cells appeared to have smaller and more numerous mitochondria. Dichloroacetate also prevented mitochondrial enlargement caused by metformin. By phase contrast, enlarged mitochondria were apparent in the metformin-treated cells while absent in the combination treatment. A second metformin sensitive cell line, T47D, was also examined. Again, enlarged mitochondria were observed with metformin treatment while these were absent in the combination treatment.
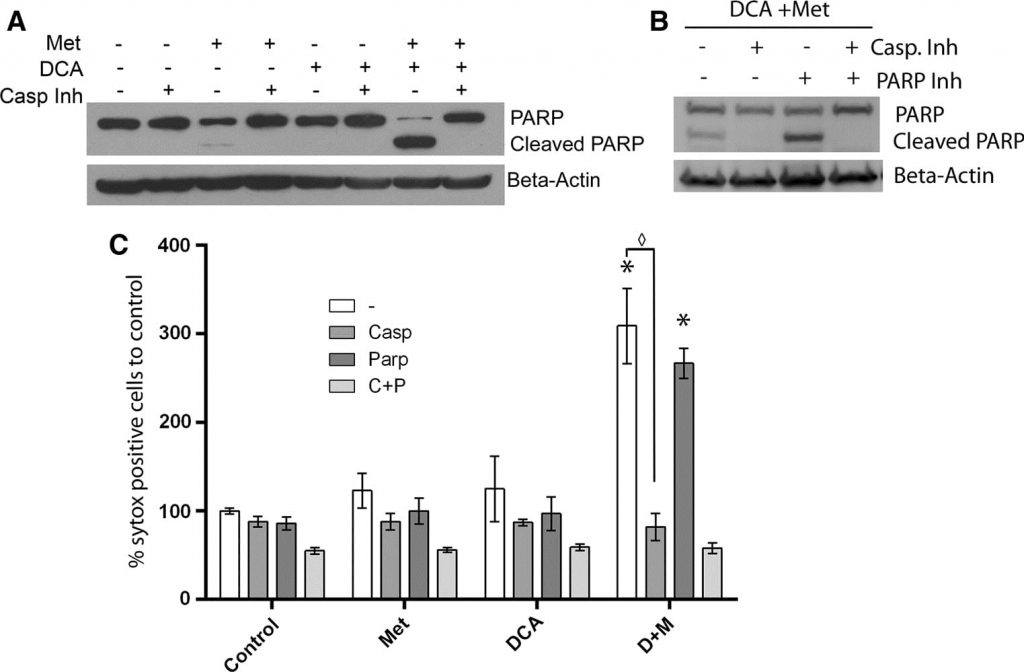
In our previous work, we found that mitochondrial enlargement correlated with PARP-dependent cell death, which was delayed in time relative to apoptotic cell death. This prompted an investigation into the specifics of the cell death mechanism induced by DCA combined with metformin [20], since no mitochondrial enlargement is observed. To characterize cell death being driven in cells co-treated with metformin and DCA, MCF7 cells were treated with an irreversible broad spectrum caspase inhibitor (Q-Val-Asp-OPh) along with DCA, metformin, or both for one day. Western blotting (Fig. 5a) revealed a large increase of cleaved PARP and decreased intact PARP in the DCA plus metformin co-treated cells. Addition of the caspase inhibitor completely blocked cleavage of PARP. A similar effect was previously seen in cells treated with metformin alone for 2.5 days [20]. However, at the one day time point, metformin alone induces only a slight increase in cleaved PARP. Therefore, these data indicate that caspase-dependent apoptosis is accelerated with the addition of DCA to metformin in these breast cancer cells. To probe further if PARP-dependent death is occurring with co-treatment of DCA and metformin, a PARP inhibitor was also used. A SYTOX Green assay was performed (Fig. 5c) two days post treatment for quantification of cell death to reveal if the PARP inhibitor had an additive effect to the caspase inhibitor. The PARP inhibitor had no protective effect alone nor any additive effect together with the caspase inhibitor. A western blot confirmed this finding (Fig. 5b) and revealed that the PARP inhibitor did not prevent PARP cleavage. As mitochondrial enlargement is associated with PARP-dependent cell death in metformin-treated cells, the lack of mitochondrial enlargement when DCA is added suggests that apoptosis is occurring exclusively in a caspase-dependent manner.
Discussion
Metformin is a long established drug used in the treatment of type two diabetes. Likewise, DCA has been studied in clinical trial for treatment of lactic acidosis and mitochondrial deficiencies. Metformin has previously been shown to slow proliferation and promote cell death of many cancer cell lines through apoptosis [9, 10, 12, 32]. Metformin concentrates in the mitochondria where it inhibits complex I of the electron transport chain, causing the abnormal flow of electrons to oxygen, producing superoxide within the mitochondrial matrix [22, Fig. 3]. Reactive oxygen species production is problematic for breast cancer cells since many of them have lower expression of manganese superoxide dismutase (MnSOD) which normally eliminates mitochondrial superoxide [33]. While metformin’s pro-apoptotic and growth inhibitory effects on cancer are noteworthy, our observation that metformin enhances glycolysis, as evidenced by increased lactate production in vitro [21], may limit its efficacy as a solo agent. As high lactate levels have been described as tumor favoring and are associated with poor clinical outcome [26, 34–38], we sought to attenuate metformin-induced lactate production as a means of potentially enhancing therapeutic efficacy. In this study, we found that DCA helps to attenuate the lactate production induced by metformin and that DCA accomplishes this through inhibition of PDK1.
Our data demonstrate that DCA and metformin synergistically induce apoptosis at a greater rate than metformin treatment alone. Our data also demonstrate that DCA diverts pyruvate toward use in oxidative phosphorylation, which leads to accumulation of ROS in the context of complex I inhibition by metformin. We conclude that this increase in ROS production leads to the faster rates of apoptosis.
In our previous work, we demonstrated that metformin induced not only caspase-dependent apoptotic cell death, but also a later occurring PARP-dependent cell death that was revealed when a pan-caspase inhibitor was used [20]. This form of cell death was associated with morphological changes in the mitochondria. In this study, DCA prevented the mitochondrial morphologic changes otherwise induced by metformin, while co-treatment also led to a faster rate of cell death. Furthermore, pan-caspase inhibition almost completely prevented cell death and eliminated PARP cleavage associated with metformin and DCA co-treatment. Together, this indicates that the cell death mechanism being driven by concurrent treatment is caspase-dependent apoptosis, and apoptosis is accelerated compared to metformin alone. It is possible that this apoptotic process is too catastrophic and does not require or allow time for the mitochondrial enlargement associated with the PARP-dependent cell death of metformin alone.
During preparation of this manuscript, a study by Choi and Lim [39] was published which explored co-treatment of DCA and metformin in cancer cells. Our results confirm and significantly extend the findings of this study. While the Choi and Lim study focused almost entirely on HeLa cells, our study demonstrates the effectiveness of the DCA and metformin combination in multiple breast cancer cell lines. Importantly, we also show that this combination of drugs does not kill the non-transformed breast epithelial cells, MCF10A, under the same conditions in which the drugs kill cancer cells. We have performed careful titrations that demonstrate very strong synergism of the drugs in inducing cell death in breast cancer cells. These results indicate that DCA will be effective at concentrations that can be achieved therapeutically in humans [27, 29], and at far lower levels than used in the experiments in the Choi and Lim study (10–20 mM) [39]. Ideally the maximum dose of DCA used to treat cancer cells would be low enough to avoid adverse effects such as neuropathy. In a study by Michelakis et al., DCA trough serum levels achieved were 0.5 mM in glioblastoma patients taking 6.25 mg/kg orally twice daily [28]. Higher doses such as 25 mg/kg are associated with dose-dependent related neuropathy. Consequently, the clinically relevant concentrations are likely to be in the range of 0.5–5 mM.
Both the results presented here and those of Choi and Lim [39] showed that cell death caused by the combination of DCA and metformin is associated with oxidative stress. We further show that this is associated with metformin-induced superoxide production by mitochondria. Dichloroacetate further elevated mitochondrial superoxide production in the presence of metformin, leading to oxidative damage to mitochondria, cellular lipids, and DNA. Novel combinations such as metformin and DCA show promise in expanding breast cancer therapies.
Acknowledgments
This article was supported by grants from Susan G. Komen for the Cure (KG100497) and the National Cancer Institute of the National Institutes of Health (1R01CA180033). Flow Cytometry and Imaging Cores were supported by COBRE Grants P20GM103548 and P20GM103620 from the National Institute of General Medical Sciences at the National Institutes of Health.
Conflict of interest
The authors declare that they have no conflict of interest.
Ethical standards
The authors declare that the experiments comply with the current laws of the country in which they were performed.
REFERENCES
1 Warburg O (1956) On the origin of cancer cells. Science 123(80):309–314. doi:10.1016/S0306-9877(96)90136-X
2 DeBerardinis RJ, Lum JJ, Hatzivassiliou G, Thompson CB (2008) The biology of cancer: metabolic reprogramming fuels cell growth and proliferation. Cell Metab 7:11–20. doi:10.1016/j.cmet.2007.10.002
3 Zamzami N, Kroemer G (2001) The mitochondrion in apoptosis : how Pandora’ s box opens. Nat Rev Mol Cell Biol 2:67–71. doi:10.1038/35048073
4 Gottfried E, Kunz-Schughart LA, Ebner S et al (2006) Tumor-derived lactic acid modulates dendritic cell activation and antigen expression. Blood 107:2013–2021. doi:10.1182/blood-2005-05-1795
5 Fischer K, Hoffmann P, Voelkl S et al (2007) Inhibitory effect of tumor cell-derived lactic acid on human T cells. Blood 109:3812–3819. doi:10.1182/blood-2006-07-035972
6 Jiralerspong S, Palla SL, Giordano SH et al (2009) Metformin and pathologic complete responses to neoadjuvant chemotherapy in diabetic patients with breast cancer. J Clin Oncol 27:3297–3302. doi:10.1200/JCO.2009.19.6410
7 Evans JMM, Donnelly LA, Emslie-Smith AM et al (2005) Metformin and reduced risk of cancer in diabetic patients. BMJ 330:1303–1304. doi:10.1136/bmj.38393.572188.EB
8 Libby G, Donnelly LA, Donnan PT et al (2009) New users of Metformin are at low risk of incident cancer. Diabetes Care 32:1620–1625. doi:10.2337/dc08-2175
9 Zakikhani M, Dowling R, Fantus IG et al (2006) Metformin is an AMP kinase-dependent growth inhibitor for breast cancer cells. Cancer Res 66:10269–10273. doi:10.1158/0008-5472.CAN-06-1500
10 Isakovic A, Harhaji L, Stevanovic D et al (2007) Dual antiglioma action of metformin: cell cycle arrest and mitochondria-dependent apoptosis. Cell Mol Life Sci 64:1290–1302. doi:10.1007/s00018-007-7080-4
11 Hadad SM, Appleyard V, Thompson AM (2008) Therapeutic metformin/AMPK activation promotes the angiogenic phenotype in the ERα negative MDA-MB-435 breast cancer model. Breast Cancer Res Treat 114:391. doi:10.1007/s10549-008-0016-3
12 Buzzai M, Jones RG, Amaravadi RK et al (2007) Systemic treatment with the antidiabetic drug metformin selectively impairs p53-deficient tumor cell growth. Cancer Res 67:6745–6752. doi:10.1158/0008-5472.CAN-06-4447
13 Sarbassov DD, Ali SM, Sabatini DM (2005) Growing roles for the mTOR pathway. Curr Opin Cell Biol 17:596–603. doi:10.1016/j.ceb.2005.09.009
14 Zhuang Y, Miskimins WK (2008) Cell cycle arrest in Metformin treated breast cancer cells involves activation of AMPK, downregulation of cyclin D1, and requires p27Kip1 or p21Cip1. J Mol Signal 3:1–11. doi:10.1186/1750-2187-3-18
15 Hinke SA, Martens GA, Cai Y et al (2007) Methyl succinate antagonises biguanide-induced AMPK-activation and death of pancreatic beta-cells through restoration of mitochondrial electron transfer. Br J Pharmacol 150:1031–1043. doi:10.1038/sj.bjp.0707189
16 Zou M-H, Kirkpatrick SS, Davis BJ et al (2004) Activation of the AMP-activated protein kinase by the anti-diabetic drug metformin in vivo. Role of mitochondrial reactive nitrogen species. J Biol Chem 279:43940–43951. doi:10.1074/jbc.M404421200
17 Owen MR, Doran E, Halestrap AP (2000) Evidence that metformin exerts its anti-diabetic effects through inhibition of complex 1 of the mitochondrial respiratory chain. Biochem J 614:607–614. doi:10.1042/0264-6021:3480607
18 Carvalho C, Correia S, Santos MS et al (2008) Metformin promotes isolated rat liver mitochondria impairment. Mol Cell Biochem 308:75–83. doi:10.1007/s11010-007-9614-3
19d Kefas BA, Cai Y, Kerckhofs K et al (2004) Metformin-induced stimulation of AMP-activated protein kinase in beta-cells impairs their glucose responsiveness and can lead to apoptosis. Biochem Pharmacol 68:409–416. doi:10.1016/j.bcp.2004.04.003
20 Zhuang Y, Miskimins WK (2012) Metformin induces both caspase-dependent and poly(ADP-ribose) polymerase-dependent cell death in breast cancer cells. Mol Cancer Res 9:603–615. doi:10.1158/1541-7786.MCR-10-0343.Metformin
21 Bailey CJ, Wilcock C, Day C (1992) Effect of metformin on glucose metabolism in the splanchnic bed. Br J Pharmacol 105:1009–1013
22Stacpoole PW, Lorenz AC, Thomas RG, Harman EM (1988) Dichloroacetate in the treatment of lactic acidosis. Ann Intern Med 108:58–63. doi:10.1056/NEJM198308183090702
23 Whitehouse BSUE, Cooper RH, Randle PJ (1974) Mechanism of activation of pyruvate dehydrogenase by dichloroacetate and other halogenated carboxylic acids. Biochem J 141:761–774. doi:10.1056/NEJM198308183090702
24 Hussien R, Brooks GA (2011) Mitochondrial and plasma membrane lactate transporter and lactate dehydrogenase isoform expression in breast cancer cell lines. Physiol Genomics 43:255–264. doi:10.1152/physiolgenomics.00177.2010
25 Kim J, Tchernyshyov I, Semenza GL, Dang CV (2006) HIF-1-mediated expression of pyruvate dehydrogenase kinase: a metabolic switch required for cellular adaptation to hypoxia. Cell Metab 3:177–185. doi:10.1016/j.cmet.2006.02.002
26 Wigfield SM, Winter SC, Giatromanolaki A et al (2008) PDK-1 regulates lactate production in hypoxia and is associated with poor prognosis in head and neck squamous cancer. Br J Cancer 98:1975–1984. doi:10.1038/sj.bjc.6604356
27 Stacpoole PW, Kurtz TL, Han Z, Langaee T (2008) Role of dichloroacetate in the treatment of genetic mitochondrial diseases. Adv Drug Deliv Rev 60:1478–1487. doi:10.1016/j.addr.2008.02.014
28 Michelakis ED, Sutendra G, Dromparis P et al (2010) Metabolic modulation of glioblastoma with dichloroacetate. Sci Transl Med 2:31ra34. doi:10.1126/scitranslmed.3000677
29 Mori M, Yamagata T, Goto T et al (2004) Dichloroacetate treatment for mitochondrial cytopathy: long-term effects in MELAS. Brain Develop 26:453–458. doi:10.1016/j.braindev.2003.12.009
30 Chou T (2010) drug combination studies and their synergy quantification using the Chou-Talalay Method drug combination studies and their synergy quantification using the Chou-Talalay Method. Cancer Res 70:440–446. doi:10.1158/0008-5472.CAN-09-1947
31 Mah L, Karagiannis TC (2010) γH2AX: a sensitive molecular marker of DNA damage and repair. Leukemia 24:679–686. doi:10.1038/leu.2010.6
32 Alimova IN, Liu B, Fan Z et al (2009) Metformin inhibits breast cancer cell growth, colony formation and induces cell cycle arrest in vitro. Cell Cycle 8:909–915. doi:7933 [pii]
33 Soini Y, Vakkala M, Kahlos K et al (2001) MnSOD expression is less frequent in tumour cells of invasive breast carcinomas than in in situ carcinomas or non-neoplastic breast epithelial cells. J Pathol 195:156–162. doi:10.1002/path.946
34 Walenta S, Wetterling M, Lehrke M et al (2000) High lactate levels predict likelihood of metastases, tumor recurrence, and restricted patient survival in human cervical cancers high lactate levels predict likelihood of metastases, tumor recurrence, and restricted patient survival in human cervical. Cancer Res 60:916–921
35 Leek R, Harris AL (2009) Lactate dehydrogenase 5 expression in squamous cell head and neck cancer relates to prognosis following radical or postoperative radiotherapy. Oncology 77:285–292. doi:10.1159/000259260
36 Isidoro A, Casado E, Redondo A et al (2005) Breast carcinomas fulfill the Warburg hypothesis and provide metabolic markers of cancer prognosis. Carcinogenesis 26:2095–2104. doi:10.1093/carcin/bgi188
37 Isidoro A, Martínez M, Fernández PL et al (2004) Alteration of the bioenergetic phenotype of mitochondria is a hallmark of breast, gastric, lung and oesophageal cancer. Biochem J 378:17–20. doi:10.1042/BJ20031541
38 Walenta S, Schroeder T (2004) Lactate in solid malignant tumors: potential basis of a metabolic classification in clinical oncology. Curr Med Chem 11:2195–2204
39 Choi YW, Lim IK (2014) Sensitization of metformin-cytotoxicity by dichloroacetate via reprogramming glucose metabolism in cancer cells. Cancer Lett 346:300–308. doi:10.1016/j.canlet.2014.01.015
Related content: