Jong-Lyel Roh a, *, Jin Young Park a , Eun Hye Kim a , Hye Jin Jang a , Minsu Kwon b
a Department of Otolaryngology, Asan Medical Center, University of Ulsan College of Medicine, Seoul, Republic of Korea
b Department of Otolaryngology, Gyeongsang National University Hospital School of Medicine, Jinju, Republic of Korea
Correspondence author: Tel.: +82 2 3010 3965; fax: +82 2 489 2773. E-mail address: [email protected] (J.-L. Roh).
Received: 9 September 2015
Revised: revised form 13 November 2015
Accepted: 14 November 2015
Abstract
Dichloroacetate (DCA), an orphan drug that promotes a shift from glycolysis to oxidative phosphorylation, has been repurposed for cancer therapy. The present study investigated whether DCA may overcome cisplatin resistance in head and neck cancer (HNC). Two cisplatin-resistant HNC cell lines (AMC-HN4R and -HN9R), their parental lines, and other human HNC lines were used. The effect of DCA, alone and in combination with cisplatin, was assessed by measuring cell cycle, viability, death, reactive oxygen species (ROS) production, mitochondrial membrane potential (ΔΨm), and protein expression in preclinical mouse tumor xenograft models. Increased glycolysis correlated with decreased sensitivity to cisplatin and was reduced by DCA. Cisplatin-resistant cells overexpressed pyruvate dehydrogenase kinase 2 (PDK2). DCA induced HNC cell death by decreasing ΔΨm and promoting mitochondrial ROS production. This effect was decreased by the antioxidant N-acetyl-l-cysteine or by inhibition of caspase-mediated apoptosis. Activation of mitochondrial glucose oxidation by DCA eventually activated downstream mitochondrial apoptotic signaling, leading to the death of chemoresistant cancer cells. Therefore, DCA significantly sensitized resistant HNC cells to cisplatin in vitro and in vivo. High glycolysis and PDK2 overexpression are closely linked to cisplatin resistance in HNC cells; the latter can be overcome by DCA.
Keywords: Head and neck cancer, Cisplatin resistance, PDK2, Dichloroacetate, Mitochondrial remodeling
Abbreviations: HNC, head and neck cancer; DCA, dichloroacetate; CDDP, cisplatin; OXPHOS, oxidative phosphorylation; PDK2, pyruvate dehydrogenase kinase 2; PDHE1α, pyruvate dehydrogenase isoform E1α; ROS, reactive oxygen species; ΔΨm, mitochondrial membrane potential; NAC, N-acetyl-l-cysteine; DCF-DA, 2′,7′- dichlorofluorescein diacetate; PARP, poly(ADP-ribose) polymerase; siRNA, short interfering RNA; 18F-FDG, 18F-fluorodeoxyglucose; PET, positron emission tomography; SUV, standardized uptake value; MTV, metabolic tumor volume; TUNEL, terminal deoxynucleotidyl transferase-mediated dUTP nick-end labeling.
© 2015 Elsevier Ireland Ltd. All rights reserved.
INTRODUCTION
Head and neck cancer (HNC) is the eighth most common cancer worldwide, with more than half a million new cases diagnosed each year [1] . The tumors arise in the upper aerodigestive tract including the oral or nasal cavity, pharynx, and larynx, and metastasize to regional lymph nodes and distant sites. The current standard of care in HNC involves a multimodal approach including surgery, chemotherapy, and radiotherapy, particularly in advanced HNC. Along with the recent interest in organ preservation strategies, non-surgical modalities, such as radiotherapy combined with chemotherapy, have been increasingly used as first-line therapy in HNC [2]. In the management of patients with advanced HNC, systemic chemotherapy is now a central component of several curative approaches, including combination with definitive radiotherapy or induction treatment, exceeding reservation just for palliation [3]. Cisplatin, the platinum derivative cis-diamminedichloroplatinum (II) (CDDP), remains a first-line chemotherapeutic agent in non-surgical modalities against HNC, despite recent advances in targeted therapy [4]. Over the last three decades, however, despite diagnostic and therapeutic advances, the overall survival rate in HNC has not changed substantially, a result of the tenacious resistance of cancer cells to therapy, including cisplatin and radiation [2].
Metabolic changes are a common feature of cancer cells: a shift in cellular energy generation from mitochondrial oxidative phosphorylation to aerobic glycolysis provides a biosynthetic advantage to cancer cells [5]. Increased glycolysis in cancer cells, called the Warburg effect, is commonly related to phenotypic changes, including adaptation to hypoxia and low nutrients, resistance to oxidative stress and apoptotic stimuli, and elevated biomass synthesis [6]. Deregulated metabolism is linked to treatment resistance in cancer therapy [7]. In the glycolytic pathway, the upregulation of glucose transporter (GLUT), hexokinase (HK), pyruvate kinase M2 (PKM2), pyruvate dehydrogenase kinase (PDK), lactate dehydrogenase-A (LDHA), fatty acid synthesis (FASN), and glutaminase, among others, is associated with cancer drug resistance [7]. Evidence shows that regulating cancer cell metabolism can improve therapy and overcome resistance to chemotherapy or radiotherapy [8,9].
Dichloroacetate (DCA), an orphan drug for lactic acidosis, shifts cancer metabolism from glycolysis to oxidative phosphorylation [10]. DCA selectively inhibits PDK, which is activated in many cancers, resulting in activation of pyruvate dehydrogenase (PDH), a complex of enzymes that convert cytosolic pyruvate to mitochondrial acetyl-CoA. Inhibition of PDK with small interfering RNA (siRNA) or treatment with DCA changes cancer bioenergetics and restores mitochondria-dependent apoptosis in cancer cells [11]. DCA is effective in treating cancers with aggressive phenotypes in vitro and in vivo[12,13] , and overcomes sorafenib resistance in hepatocellular carcinoma by activating mitochondrial oxidative phosphorylation [14]. Therefore, DCA may be a suitable anticancer drug to increase the efficacy of chemotherapy and to overcome resistance to chemotherapeutic agents in human cancer; however, although DCA has been extensively studied in cancer, it has been rarely tested in HNC cells [15], particularly in the setting of resistance to chemotherapeutic agents. Further investigation of DCA mechanisms and synergy with conventional chemotherapeutic agents is needed. Here, we show that DCA shifts HNC bioenergetics to mitochondrial glucose oxidation and leads to cellular accumulation of mitochondrial reactive oxygen species (mROS), thereby sensitizing chemoresistant HNC cells to cisplatin in vitro and in vivo.
Materials and methods
Cell culture and establishment of cisplatin-resistant HNC cells
The human head and neck cancer (HNC) cells AMC-HN2, -HN3, -HN4, -HN5, -HN9, and -HN10 were grown in Eagle’s minimum essential medium (Life TechnologiesTM , Carlsbad, CA, USA); SNU-1041, -1066, and -1076 cells were grown in Roswell Park Memorial Institute medium (Life TechnologiesTM ); and UMSCC1 cells were grown in Dulbecco’s modified Eagle medium (Life TechnologiesTM ). The media were supplemented with 10% fetal bovine serum. All cancer cell lines were authenticated by DNA profiling (short-tandem-repeat, STR) provided by the Korean Cell Line Bank. The cells were incubated at 37 °C in a humidified atmosphere containing 5% CO2.
Cisplatin-resistant AMC-HN4 and HN9 (HN4R and HN9R) cells were developed from the parental cisplatin-sensitive AMC-HN4 and HN9 cells, respectively, by exposure to increasing concentrations of cisplatin (cis-platinum (II) diamine dichloride [CDDP]; Sigma-Aldrich, Louis, MO, USA) [16] . The cisplatin resistance in the established cell lines was evaluated by cell viability assays and compared to that of the parental cells.
Cell viability assay
Cell viability was determined by trypan blue exclusion, MTT, and clonogenic assays. Trypan blue exclusion was performed in HNC cells seeded at 1 x 10⁵ in 6-well plates. The cells were allowed to reach 60-70% confluence and were exposed to dichloroacetate (DCA; Sigma-Aldrich) for 72 h. The cells were then trypsinized, stained with 0.4% trypan blue (Life TechnologiesTM ), and counted using a hemacytometer. The MTT assay was performed in HNC cells seeded at 3-5 x 10³ cells per well in 96-well plates. The cells were incubated overnight and then exposed to DCA and cisplatin, alone or in combination, for 72 h. The cells were then exposed to the tetrazolium compound 3-[4,5-dimethyl-2-thiazolyl]-2,5-diphenyl-2H-tetrazolium bromide (MTT; Sigma-Aldrich) for 4 h, after which solubilization buffer was added for 2 h. The absorbance in each well was measured at 570 nm using a SpectraMax M2 microplate reader (Molecular Devices, Sunnyvale, CA, USA). For clonogenic assays, cells were exposed to DCA or vehicle for 72 h and then incubated in drug-free medium for 7-10 days. The wells were stained with 0.5% crystal violet solution, and the number of colonies was counted. All the assays were performed with triplicate samples and repeated three times.
Cisplatin cytotoxicity was assessed by MTT after 72 h, and the half maximal inhibitory concentration (IC50) of each HNC cell was calculated. The interaction of two drugs was considered synergistic when the growth inhibition induced by the drug combination was greater than the sum of the inhibitions induced by either drug alone: combination index (CI) = 1, additive interaction; CI < 1, synergistic interaction; and CI > 1, antagonistic interaction [17] .
Measurement of bioenergetics and ROS production
HNC cells (1 x 10⁴ cells per well) were seeded in 24-well plates, and the next day, they were washed and incubated in serum-free DMEM supplemented with or without 100 ng/mL oligomycin (an ATP synthase inhibitor; Sigma-Aldrich) for 6 h. The culture medium (50 µL) was collected from each plate, and the lactate concentration of the culture medium was measured with a lactate assay kit (Biovision, Mountain View, CA, USA). Lac (o) and Lac (c) denote the lactate concentration in the medium after 6 h of incubation in the presence and absence of oligomycin, respectively. The contribution of glycolysis and oxidative phosphorylation (OXPHOS) to cellular bioenergetics was calculated with the following formula: glycolysis (%) = Lac (c)/Lac (o) x 100; OXPHOS (%) = 100 – glycolysis (%) [14] .
Cells were exposed to 15 or 30 mM DCA for 24 h, and ROS generation was detected in cells incubated with 10 µM 2′,7′-dichlorofluorescein diacetate (DCF-DA) (Enzo Life Sciences, Farmingdale, NY, USA). Cells were incubated with 10 µM DCF-DA for 30 min at 37 °C, washed twice with PBS, and analyzed in a FACScalibur flow cytometer. Cells were also pretreated with 3 mM N-acetyl-l-cysteine (NAC; Sigma-Aldrich) for 1 h or 10 µM superoxide dismutase (SOD) inhibitor diethyl-dithio-carbamate (Sigma-Aldrich) before exposure to 30 mM DCA. ROS levels were measured by flow cytometry using DCF-DA and are shown as the fold change over control (basal) levels.
Cell cycle and cell death assays
For cell cycle assays, cells were exposed to DCA for 72 h. The cells were then trypsinized, fixed overnight in ice-cold ethanol, and stained for 30 min with propidium iodide (Sigma-Aldrich) at 37 °C. The cellular DNA content was measured using a FACScalibur flow cytometer (BD Bioscience, San Jose, CA, USA). For cell death assays, cells were cultured with cisplatin and DCA, alone or in combination, or an equivalent amount of DMSO (vehicle control). After 72 h, cells were harvested, washed with ice-cold PBS, and resuspended in binding buffer. Cells were stained with annexin V-FITC (fluorescein isothiocyanate) and propidium iodide using an annexin V-FITC apoptosis detection kit (BD Biosciences, Franklin Lakes, NJ, USA), and then analyzed by flow cytometry. All data were analyzed using the Cell Quest software (BD Biosciences). The statistical significance between different treatment groups was assessed by two-tailed Mann-Whitney U-test or Student’s t-test.
For caspase activity assays, HN4R and HN9R cells seeded in a 96-well plate were exposed to 100 µL of medium containing cisplatin and DCA alone or in combination, for 72 h, with or without 3 mM NAC or 50 µM of Z-VAD-fmk (R&D Systems, Minneapolis, MN, USA) before exposure to 30 mM DCA. The assays were performed in triplicate wells using the fluorimetric Homogeneous Caspase Assay (Roche Life Science, Basel, Switzerland). The working substrate solution was added, and the plate was incubated in the dark at 37 °C for 2-8 h or at room temperature overnight. The absorbance in each well was measured at an excitation wavelength of 485 nm and an emission wavelength of 520 nm using a SpectraMax M2 microplate reader.
For measurement of mitochondrial membrane potential (ΔΨm), HN4R and HN9R cells seeded in a 96-well plate were exposed to 100 µL of medium containing cisplatin and DCA alone or in combination for 36 h. The cells were stained with 200 nM tetramethylrhodamine ethyl ester (TMRE, Life Technologies TM ) for 20 min and then analyzed by flow cytometry. The mean fluorescence intensity (MFI) of each treatment group was normalized to the control group.
Real-time quantitative reverse transcription-PCR
Total cellular RNA was extracted using the QIAzol lysis reagent and the RNeasy Mini Kit (Qiagen, Valencia, CA, USA). cDNA was generated from purified RNA using a QuantiTect Reverse Transcription Kit (Qiagen) according to the manufacturer’s instructions. Pyruvate dehydrogenase kinase 2 (PDK2) cDNA was amplified by PCR using the following primers: 5′-ATGGCAGTCCTCCTCTCTGA-3′ (forward) and 5′-CACCCACCCTCTTCCTAACA-3′ (reverse). For β-actin (an endogenous control), the following primers were used: 5′-ACCCCCACTGAAAAAGATGA-3′ (forward) and 5′-ATCTTCAAACCTCCATGATG-3′ (reverse). Real-time quantitative reverse transcription-PCR (qRT-PCR) was performed using SYBR Green (Qiagen) on a 7900HT Fast Real-time PCR System (Applied Bioscience, Foster, CA, USA). Relative target mRNA levels were normalized to β-actin expression.
siRNA
For knockdown of PDK2 and PDHE1α, AMC-HN4-cisR and HN9-cisR were seeded onto 60 mm plates in medium without antibiotics, and 18 h later, they were transfected with 100 nmol/L small interfering RNA (siRNA) targeting the human PDK2 or PDHE1α gene or a scrambled control siRNA (Life Technologies TM ). After 72 h, cells were exposed to DCA for an additional period of 72 h and then analyzed for protein expression. The knockdown was confirmed by Western blotting using anti-PDK2 or PDHE1 antibodies.
Immunoblotting
Cells were lysed at 4 °C in radioimmunoprecipitation assay (RIPA) buffer (Life TechnologiesTM ). Immunoblotting was performed according to standard procedures. Briefly, a total of 50 µg of protein was resolved by sodium dodecyl sulfate-polyacrylamide gel electrophoresis (SDS-PAGE) on 10-12% gels, transferred to nitrocellulose or polyvinylidene difluoride membranes, and probed with primary and secondary antibodies. The following primary antibodies were used: p53 (DO1) (Santa Cruz Biotechnology, Santa Cruz, CA, USA); hexokinase 2 (HK2), p21 WAF1/CIP1 , PUMA, cleaved poly(ADP-ribose) polymerase (PARP), phospho-p53-Ser15, and cleaved caspase-3 (Cell Signaling Technology, Danvers, MA, USA); PDK2 (Abcam, Cambridge, MA, USA); and PDHE1α and phospho-PDHE1α (ser293) (Calbiochem, Billerica, MA, USA). β-Actin (Sigma-Aldrich) was used as the loading control. All antibodies were diluted between 1:250 and 1:5000.
Confocal microscopy
ΔΨm was imaged in live cancer cells using TMRM (Life TechnologiesTM ), a mitochondria-sensitive, voltage-sensitive rhodamine-based dye (red fluorescence). Mitochondrial superoxide (mROS, Life TechnologiesTM ) produced during cell respiration was measured by MitoSOX (red fluorescence). TMRM or mitoSOX fluorescence images were captured by a Zeiss LSM 510 two-photon confocal microscope (Carl Zeiss AG, Heidenheim, Germany), and the mean fluorescence was quantified (arbitrary fluorescence units, AFU) in cancer cells in culture using the Zen imaging software (Carl Zeiss AG). The image acquisition and analyses were performed by two scientists who were blinded to the source of cell specimens.
Positron emission tomography (PET) imaging
Glucose uptake was imaged in vivo in nude mice with transplantation of HN4R or HN9R cells using isoflurane gas anesthesia (20% oxygen) and 18 F-fluorodeoxyglucose (18 F-FDG) as a radiotracer. PET imaging was performed using microPET FOCUS 120 (Concorde Microsystem Inc., Knoxville, TN, USA). The mice fasted overnight and were then intravenously injected with 0.15 mCi. After 1 h, 18 F-FDG PET scanning was performed in the whole body. PET data acquisition images are shown using a pseudocolor map with red color indicating high 18 F-FDG uptake.
Maximum and mean standardized uptake value (SUVmax and SUVmean) were used to determine 18 F-FDG-PET activity. The SUV was analyzed using the equation SUV = A/(ID/BW), where A is the decay-corrected activity in tissue (in mCi/mL), ID is the injected dose of FDG (in mCi), and BW is the mouse body weight (in grams). Spherical or elliptical regions of interest (ROIs) were placed over the lesions visible on PET images. The SUVmax and SUVmean were calculated by automatically drawing an ROI over the most intense slice of the tumors visible on PET images. MTVs were computed from attenuation-corrected PET data using a commercial software package (INFINITT PACS; INFINITT Healthcare Co., Ltd). 18 F-FDG PET data were fed into the workstation in DICOM format, and intensity values were automatically converted to SUVs. For MTV calculations, the contouring margins of the tumor were defined using a fixed SUV of 2.0, and the tumor volume was then delineated with the SUV 2.0 isocontour. The PET images were obtained in tumor-implanted mice on day 21 after the beginning of treatment. The mean values of tumor SUVmax and MTV values were compared between the different treatment groups.
Preclinical studies
All animal study procedures were performed in accordance with protocols approved by the Institutional Animal Care and Use Committee of our institution. Six-week-old athymic BALB/c male nude mice (nu/nu) were purchased from Central Lab Animal Inc. (Seoul, Republic of Korea). AMC-HN4R or HN9R cells (5 x 10 6 ) were injected subcutaneously into the flank. Tumor volume and body weight were measured every 3 days. Tumors were measured using a caliper, and volume was calculated as (length x width2 )/2. Treatment began when the cell implants became palpable nodules (=day 0). Mice were randomized into four treatment groups: vehicle, DCA, cisplatin, and DCA plus cisplatin.
Mice were treated with drinking water supplemented with 0.5 g/L DCA, or by i.p. injection of 5 mg/kg cisplatin once per week, or with a combination of DCA and cisplatin according to the same schedules. The mice were sacrificed on day 24, and tumors were isolated and analyzed by immunoblotting and in situ terminal deoxynucleotidyl transferase-mediated dUTP nick-end labeling (TUNEL) assay (EMD Millipore, Billerica, MA, USA). The number of apoptotic bodies was counted blindly in ten randomly selected high-power fields. The statistical significance between different treatment groups was assessed by two-tailed Mann-Whitney U-test or Student’s t-test.
Results
Increased glycolysis in HNC cells is associated with resistance to cisplatin and reversed by DCA
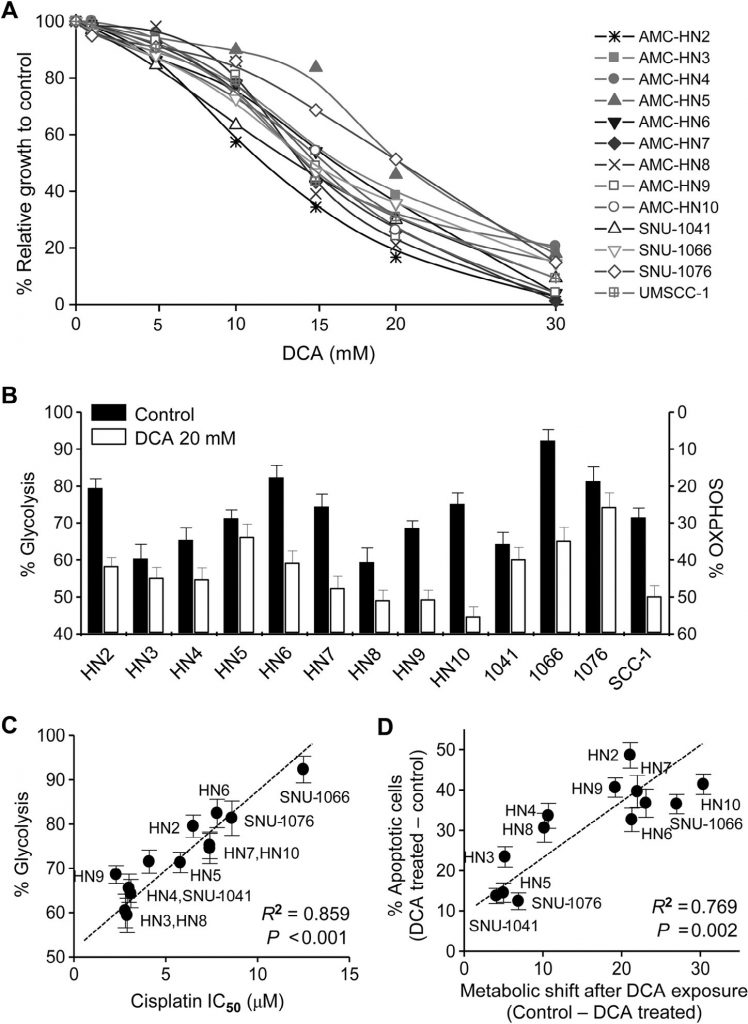
All cell lines used in our study were human HNC. The cytotoxic effect of DCA was assessed in HNC cells by trypan blue exclusion, crystal violet staining, and MTT assay. DCA, tested up to 30 mM for 72 h, markedly inhibited the growth of HNC cells (MTT assay, Fig. 1A ). The bioenergetics of HNC cells were changed by DCA: cellular glycolysis significantly decreased, while oxidative phosphorylation increased (Fig. 1B ). The change in bioenergetics varied between the HNC cell lines and was significantly associated with sensitivity to cisplatin: HNC cells with high glycolysis showed resistance to cisplatin (R2 = 0.859, P < 0.001;Fig. 1C ). Further, upon exposure to DCA, the cancer cells with the largest change in bioenergetics were likely to become more apoptotic (R2 = 0.769, P = 0.002; Fig. 1D ). This suggests that DCA induces cancer cell-specific apoptosis by decreasing glycolysis in HNC cells.
PDK2 expression is associated with cisplatin resistance in HNC
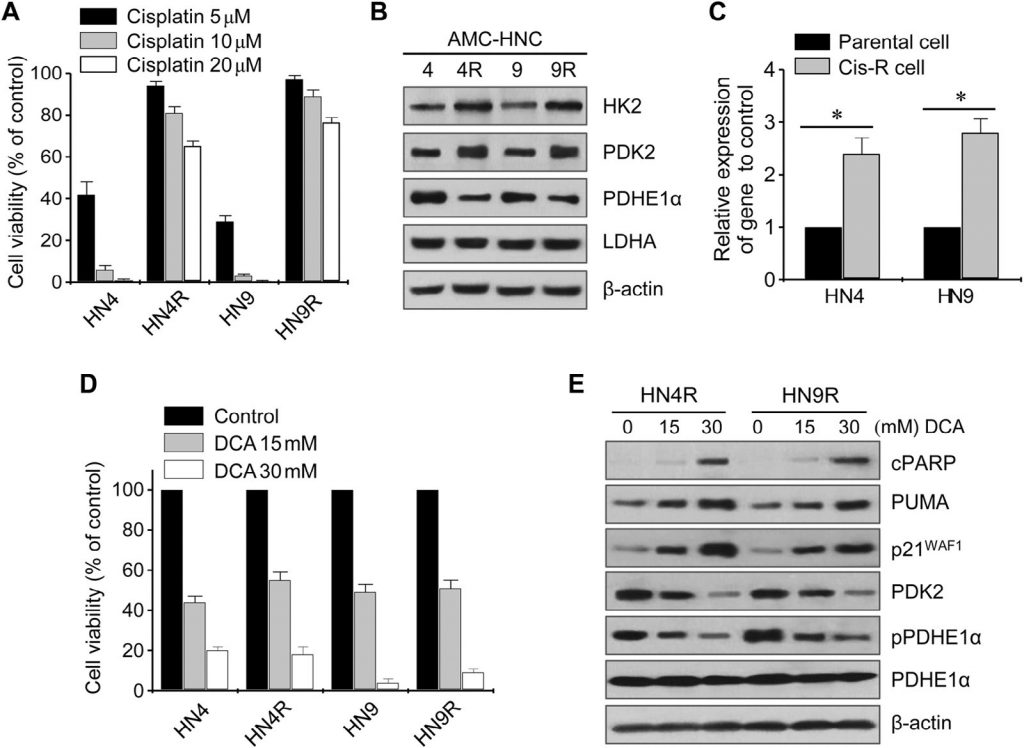
The cytotoxic effects of cisplatin were tested in cultured HN4-cisR and HN9-cisR and parental cancer cell lines (Fig. 2A). Cisplatin-resistant HN4-cisR and HN9-cisR cells showed a 12-fold and 18-fold increase in IC50, respectively, compared to their respective parental lines. Western blot analysis showed that HK2 and PDK2 were highly expressed in both HN4-cisR and HN9-cisR cells compared to the respective parental cells, while the expression of PDHE1α was low in the cisplatin-resistant cells ( Fig. 2B ). The expression level of PDK2 mRNA was also higher in the resistant cells than in the sensitive cells (P < 0.01) (Fig. 2C). DCA inhibited the growth of cisplatin-resistant HNC cells as much as it did that of cisplatin-sensitive HNC cells (Fig. 2D). Western blot analysis showed that DCA significantly decreased the levels of PDK2 and phospho-PDHE1α (pPDHE1α) but increased the level of proapoptotic proteins, including cleaved PARP (cPARP) and PUMA, and that of p21 in HN4-cisR and HN9-cisR (Fig. 2E). This suggests that DCA can effectively inhibit the growth of cisplatin-resistant HNC cells as well as that of cisplatin-sensitive HNC cells.
DCA induces ROS accumulation in HNC cells
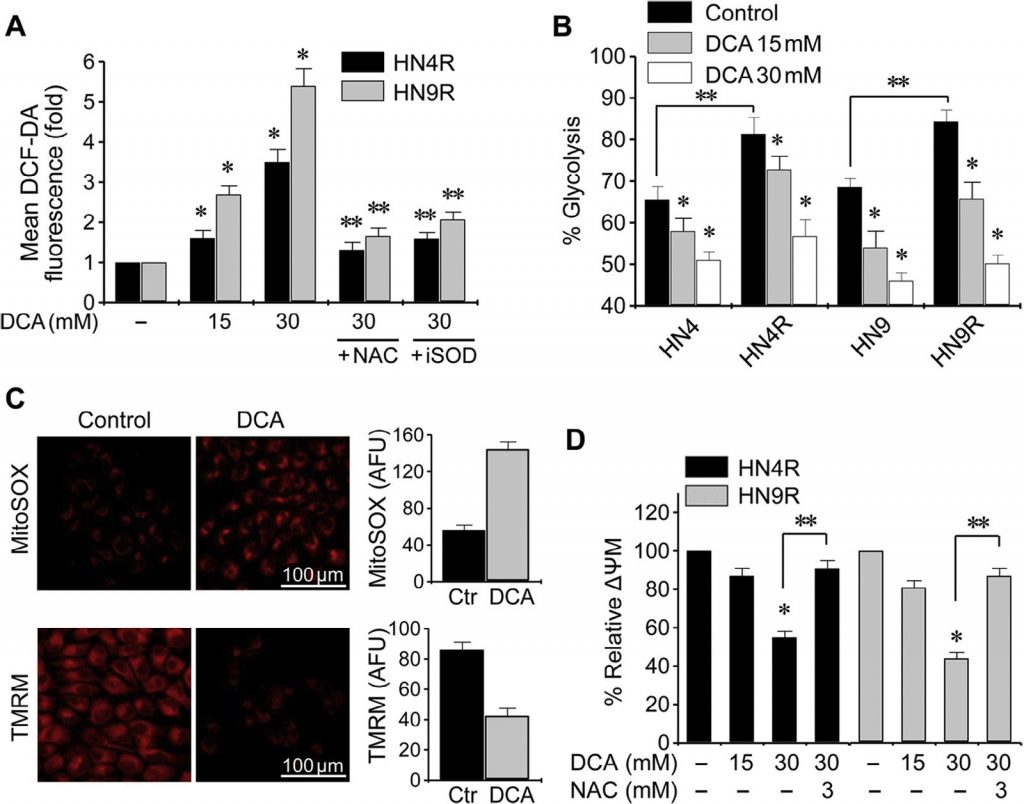
The change in cellular ROS by DCA was assessed by flow cytometry using the redox-sensitive fluorescent probe DCF-DA. Exposure to DCA caused a significant increase in ROS levels in HNC cells (P < 0.01), which was blocked by co-exposure with NAC or the SOD inhibitor diethyl-dithio-carbamate (Fig. 3A). Glycolysis significantly increased in cisplatin-resistant HNC cells compared to their parental cells (P < 0.01), but DCA induced a significant decrease in glycolysis and increase in oxidative phosphorylation in both cisplatin-sensitive and cisplatin-resistant HNC cells (P < 0.01) ( Fig. 3B ). Mitochondrial membrane potential (ΔΨm) was measured using TMRM, a mitochondria-sensitive, voltage-sensitive rhodamine-based dye, and mitochondrial ROS (mROS, mitochondrial superoxide) was measured using MitoSOX red. DCA-treated HNC cells showed decreased ΔΨm and increased mROS (P < 0.01) (Fig. 3C). The change in ΔΨm in cisplatin-resistant HNC cells upon exposure to DCA was blocked by pretreatment with NAC (Fig. 3D). This suggests that DCA can induce ROS accumulation in HNC cells by activating oxidative phosphorylation.
DCA promotes cell cycle arrest and apoptosis in HNC cells
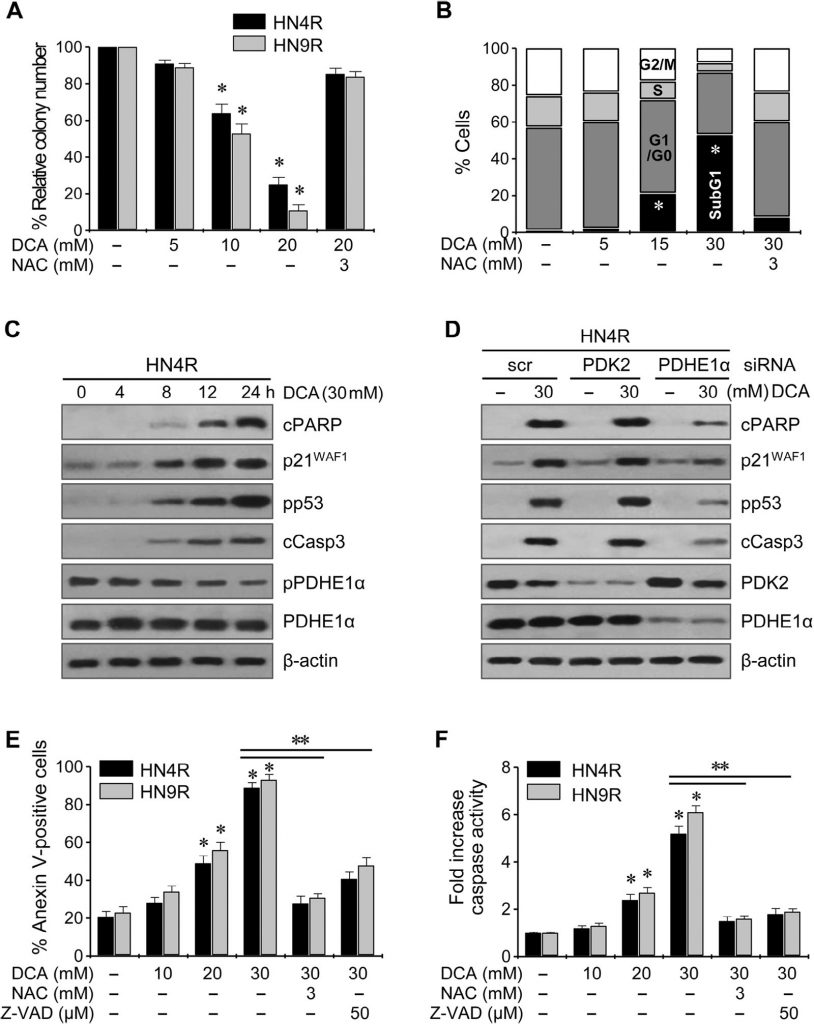
Clonogenic assays resulted in a marked decrease in the number of HN4-cisR and HN9-cisR colonies upon exposure to DCA (P < 0.01) (Fig. 4A ). Flow cytometry using propidium iodide staining showed a significant cell cycle change in HNC cells: wogonin increased the sub-G1 apoptotic population (P < 0.05), and this effect was blocked by co-exposure with NAC (Fig. 4B ). Western blot analysis showed that DCA decreased pPDHE1α but increased cPARP, p21, phospho-p53, and cleaved caspase-3 (cCasp3) in a time-dependent manner (Fig. 4C ). PDHE1α activation by knockdown of PDK2 in AMC-HN4-cisR cells did not significantly increase the proapoptotic proteins cPARP and cCasp3 (Fig. 4D ); however, knockdown of PDHE1α decreased the p21 expression and p53 phosphorylation. Flow cytometry using propidium iodide and annexin-V staining showed effective induction of apoptosis and cell death in cisplatin-resistant HNC cells by DCA; the effect was reduced upon co-exposure to DCA and the antioxidant NAC or the pan-caspase inhibitor Z-VAD-fmk ( Fig. 4E ). This was confirmed by the measurement of caspase activity, which was significantly increased by DCA in a concentration-dependent manner (Fig. 4F ).
DCA sensitizes cisplatin-resistant HNC cells to cisplatin in vitro and in vivo
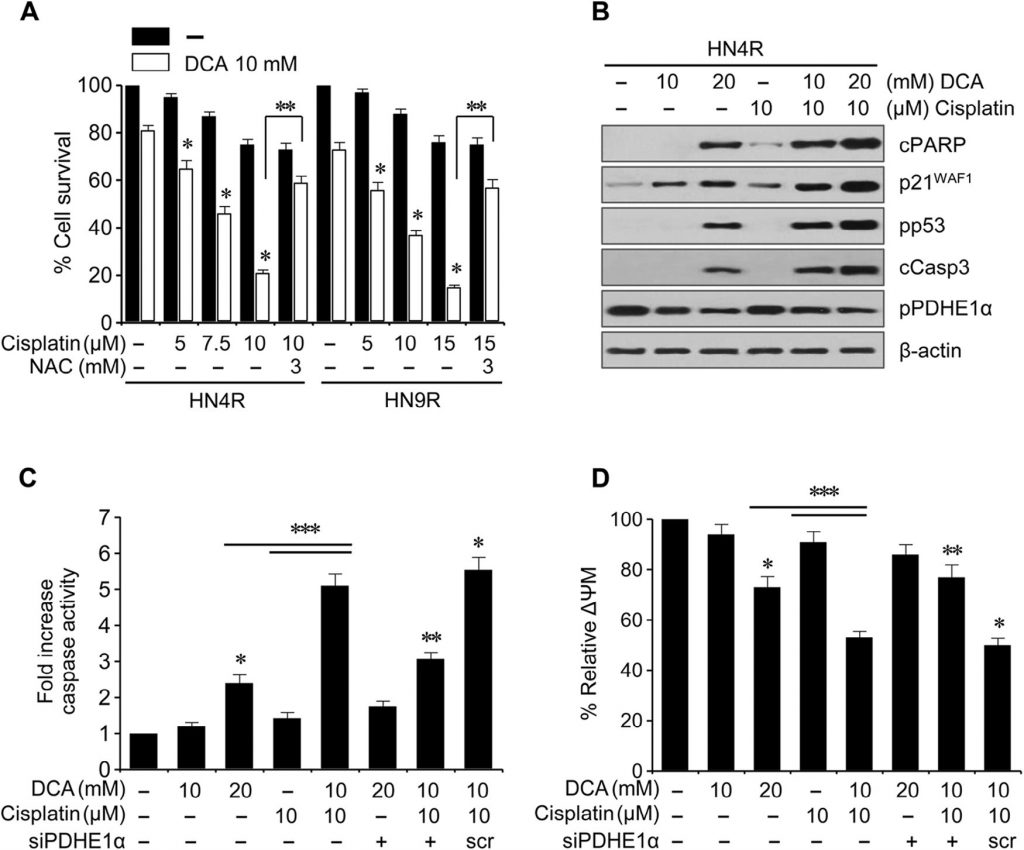
Cisplatin (10 µM) did not induce any significant cytotoxicity or apoptotic protein expression in the cisplatin-resistant HNC lines HN4-cisR and HN9-cisR compared to the parental cisplatin-sensitive lines HN4 and HN9 (Fig. 5A); however, DCA induced a marked decrease in survival in the cisplatin-resistant HNC cells (P < 0.05), which was blocked by pretreatment with NAC. DCA induced the expression of apoptotic proteins and increased the cisplatin-induced cytotoxicity and apoptotic protein expression in HN4-cisR cells (Fig. B). In combination, DCA increased the cytotoxicity of cisplatin in HN4-cisR cells by increasing the caspase activity to an extent greater than the sum of the effects of either agent alone (CI < 1, P < 0.01), which were weakened by PDHE1α gene silencing (Fig. 5C). The ΔΨm was higher in the cisplatin-resistant HN4-cisR cells than in the cisplatin-sensitive parental HN4 cells (ΔΨm, mean fluorescence intensity [MFI]: 1 ± 0 vs. 0.54 ± 0.09, P < 0.001) and reduced by DCA or the combination of cisplatin and DCA, which was abrogated by PDHE1α gene silencing (Fig. 5D).
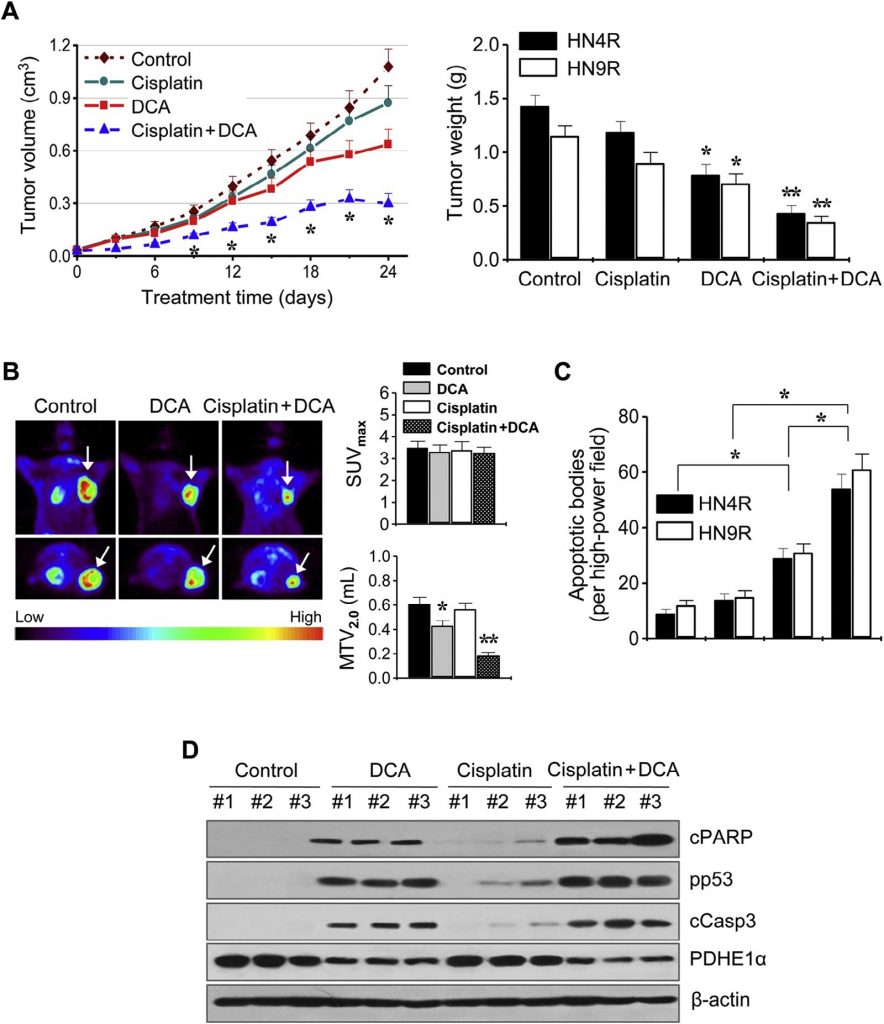
These findings were further examined in in vivo tumor xenograft mouse models. BALB/c athymic nude mice bearing AMC-HN4-cisR or HN9-cisR tumors were treated with DCA, cisplatin, DCA plus cisplatin, or vehicle. The combination of cisplatin and DCA synergistically suppressed tumor growth (Fig. 6A). In vivo imaging of tumor growth was conducted by 18 F-FDG PET on day 21 of treatment. Focal 18 F-FDG uptakes were observed at the sites of tumor implantation, where maximum standardized uptake (SUVmax) and metabolic tumor volume at SUV 2.0 (MTV2.0) were measured. The SUVmax was not different between the treatment groups (P > 0.1), but the MTV2.0 was significantly lower in the DCA- and combination-treated groups than in other groups (P < 0.05) (Fig. 6B). In situ apoptosis assays showed that TUNEL-positive apoptotic bodies were more frequently seen in tumors treated with DCA and cisplatin plus DCA than in those treated with vehicle (P < 0.01) (Fig. 6C). Western blot analyses of tumor tissues showed that apoptotic protein levels increased to a greater extent in HN4-cisR cells treated with the combination of cisplatin and DCA than in tumors treated with single agents (Fig. 6D).
Discussion
Increased glycolysis, which is frequently found in cancer, is closely linked to mitochondrial impairment or defective oxidative phosphorylation and contributes to therapeutic resistance [18,19]. Aerobic glycolysis has been implicated in resistance to chemotherapy [20] or radiotherapy [21]. In the present study, cisplatin-resistant cell lines show elevated glycolysis, indicating a biochemical link between glycolysis and chemoresistance. Drug-resistant cells exhibit a greater need for ATP than normal cells to maintain cellular homeostasis and activate the survival pathways that permit escape from cell death under genotoxic stress [20]. Resistant cancer cells increase glycolysis to generate ATP rapidly to meet intracellular demand. This was clearly found in our cisplatin-resistant cells compared to the parental sensitive cells, indicating that drug resistance in HNC is directly associated with an increase in glycolysis. This implies that the bioenergetic change of cancer cells toward increased glycolysis is linked to chemoresistance [14,22]. Therefore, the level of glycolysis in human cancers may be a biomarker of chemoresistance and requires clinical validation in human cancer tissues.
The present study shows that DCA shifts energy generation from glycolysis to mitochondrial glucose oxidation in HNC. This DCA-induced reversal of the metabolic shift toward glycolysis eliminates the proliferative advantage of cancer cells and eventually leads to cell death [23]. DCA, as a structural analog of pyruvate, inhibits PDK and reactivates PDH, an enzyme that is part of the complex that converts pyruvate to acetyl-CoA, the primary substrate of the Krebs’ cycle [10,23] . Since most cancer types produce a hypoxic environment, cancer cells rely on anaerobic glycolysis as a primary energy source. The activation of hypoxia-inducible factor (HIF) induces mitochondrial PDK [24]. Mitochondrial PDH activity in cancer is blocked by PDK, resulting in a lower availability of acetyl-CoA for mitochondrial glucose oxidation [24]. Increased expression of PDK is associated with drug resistance in cancer [25,26] . Upregulation of PDK2 by mitochondrial mutations and HIF1α stabilization is also observed in HNC cells [27] . In the present study, the association between overexpression of PDK2 and cisplatin resistance in HNC cells was also confirmed. These findings indicate the importance of PDK as a novel molecular target in cancer therapy [10] . Prior data showed that genetic or pharmacological inhibition of PDK changes cancer bioenergetics and restores mitochondria-dependent apoptosis in cancer cells [11,13] . Therefore, DCA is effective at overcoming treatment resistance in cancers with aggressive phenotypes in vitro and in vivo[12-14] .
Activation of PDH by DCA induces the accumulation of mROS in cancer cells. Cancer cells have decreased mitochondrial glucose metabolism, resulting in decreased electron transport chain (ETC) activity and decreased mROS [10], [28]. The mitochondrial remodeling of ΔΨm hyperpolarization and decreased mROS production in cancer leads to resistance to apoptosis under genotoxic stress. In resistant cancer cell with a more glycolytic phenotype, HK2 results in its translocation to the outer mitochondrial membrane and the increase in ΔΨm [29]. Inhibition of glycolysis and HK2 translocation decreases cancer ΔΨm and reverses the resistance to apoptosis [29]. In the present study, the increased HK2 and PDK2 expression and mitochondrial membrane potential were also found in cisplatin-resistant cancer cells. DCA forces pyruvate entry into the mitochondria via activation of PDH, the gate-keeping regulator of mitochondrial glucose oxidation, and decreases ΔΨm and increases mROS [13]. In the present study, DCA simply reversed the elevated mitochondrial remodeling in cisplatin-resistant HNC cells, which contributed to cancer cell death. Activation of mitochondrial glucose oxidation by DCA induced mROS and activation of downstream mitochondrial signaling, resulting in activation of p53 and its related proapoptotic pathways and leading to the death of chemoresistant cancer cells. In our study, pharmacological inhibition of mROS production or caspase-mediated apoptosis attenuated the cytotoxic effect of DCA in HNC cells, which confirms the known mechanisms of the drug.
Preclinical and clinical studies support the use of DCA in cancer patients and in patients with lactic acidosis associated with mitochondrial diseases [10,23] . A number of studies demonstrate the cytotoxic effects of DCA, alone or in combination with other treatments, in a variety of tumors derived from all three germ layers [23]. A prior study showed that glioblastoma, one of the most aggressive human cancers, overexpresses PDK2 in cancer tissues excised from 49 patients and regressed in five patients upon treatment with DCA, proving the clinical benefit of DCA in resistant cancers [13] . In HNC, a recent study compared the effect of DCA in three oral squamous cell carcinoma (OSCC) cell lines [15] . The OSCC cells exhibiting deficient mitochondrial oxidative phosphorylation (i.e., high glycolysis) were more sensitive to DCA than others [15,30]. The present study confirmed that HNC cells with high bioenergetic changes were more sensitive to DCA. In fact, since chemoresistant cancer cells tend to have high glycolysis, the cells might be targetable by metabolic inhibitors [31]. Therefore, DCA is a good candidate to treat cancer cells with aggressive phenotypes, including chemoresistant HNC cells. However, because the potential anti-cancer effects of DCA are still controversial, particularly in tumors under hypoxia, further preclinical and clinical studies on DCA and cancer are required [32]. A recent systematic review shows that DCA synergizes with many standard anti-cancer agents, and early phase clinical trials suggest that chronic DCA is safe and well tolerated when orally administered 12.5 mg/kg twice daily [23].
Our study revealed that DCA synergizes with cisplatin and thereby circumvents resistance to cisplatin in HNC cells. Since cisplatin is a first-line chemotherapeutic agent in HNC, the combination of cisplatin and DCA may be effective in the clinical setting to reduce toxicity and overcome cancer drug resistance. Prior reports showed that DCA potentiates the cytotoxic effect of cisplatin by inducing mitochondria-dependent apoptosis [33,34]. The linkage of two DCA molecules to cisplatin, called mitaplatin, induces the selective killing of cancer cells [35,36]. These results provide evidence that DCA may have additional benefits in combination with current anticancer therapies. In our study, DCA and its combination with cisplatin did not affect SUVmax but significantly decreased MTV2.0. This means that DCA effectively suppresses the in vivo tumor growth despite the fact that there is no significant change of maximal glucose uptakes in the tumor-located ROIs. The present study is the first to show that DCA restores the cytotoxic effect of cisplatin in drug-resistant HNC cells in vitro and in vivo. DCA induced a robust increase in cisplatin-mediated apoptosis via activation of p53, PARP, and caspase in cisplatin-resistant HNC cells. DCA sensitized drug-resistant HNC cells to cisplatin, leading to increased cytotoxicity and more effective therapy for aggressive HNC. Taken together, these findings may be of paramount clinical significance: inducing the death of resistant cells with DCA could reduce the dose of cisplatin required in the clinical setting and thereby minimize the potential adverse effects of cisplatin chemotherapy.
In conclusion, our data suggest that high glycolysis and PDK overexpression are closely linked to cisplatin resistance in HNC cells. DCA switches the bioenergetics of HNC cells toward mitochondrial oxidative phosphorylation. This leads to a decrease in ΔΨm and an increase in mROS, thereby sensitizing chemoresistant HNC cells to cisplatin in vitro and in vivo. These data warrant further preclinical and clinical investigations of DCA, a promising anticancer drug candidate, in HNC with aggressive phenotypes. However, our conclusion should be taken into consideration with caution, in an opposite scenario. The defective mitochondrial oxidative phosphorylation was related to the sensitivity of cancer cells to low glucose condition, which might be used in a biomarker for cancer therapy [37]. Cancer cell is also adapted to facilitate proliferation through the uptake and incorporation of nutrients into the biomass rather than for efficient ATP production [38]. Therefore, the preclinical and clinical effects of DCA on HNC and other cancer types should be further examined.
Acknowledgements
This study was supported by a grant (2015R1A2A1A15054540) from Basic Science Research Program through the National Research Foundation of Korea (NRF), Ministry of Science, ICT, and Future Planning, and a grant (HI14C23050000) from the Korean Health Technology R&D Project, Ministry of Health & Welfare, Seoul, Republic of Korea (J.-L. Roh).
Conflict of interest
The authors declare no conflicts of interest.
REFERENCES
1 A. Jemal, F. Bray, M.M. Center, J. Ferlay, E. Ward, D. Forman, Global cancer statistics, CA Cancer J. Clin, Vol. 61, 2011, 69-90
2 R.I. Haddad, D.M. Shin, Recent advances in head and neck cancer, N. Engl. J. Med, Vol. 359, 2008, 1143-1154
3 E.B. Lamont, E.E. Vokes, Chemotherapy in the management of squamous-cell carcinoma of the head and neck, Lancet Oncol, Vol. 2, 2001, 261-269
4 F. Petrelli, A. Coinu, V. Riboldi, K. Borgonovo, M. Ghilardi, M. Cabiddu, Concomitant platinum-based chemotherapy or cetuximab with radiotherapy for locally advanced head and neck cancer: a systematic review and meta-analysis of published studies, Oral Oncol, Vol. 50, 2014, 1041-1048
5 D. Hanahan, R.A. Weinberg, Hallmarks of cancer: the next generation, Cell, Vol. 144, 2011, 646-674
6 J.R. Cantor, D.M. Sabatini, Cancer cell metabolism: one hallmark, many faces, Cancer Discov, Vol. 2, 2012, 881-898
7 Y. Zhao, E.B. Butler, M. Tan, Targeting cellular metabolism to improve cancer therapeutics, Cell Death Dis, Vol. 4, 2013, e532
8 R.A. Cairns, I.S. Harris, T.W. Mak, Regulation of cancer cell metabolism, Nat. Rev. Cancer, Vol. 11, 2011, 85-95
9 R.H. Xu, H. Pelicano, Y. Zhou, J.S. Carew, L. Feng, K.N. Bhalla, Inhibition of glycolysis in cancer cells: a novel strategy to overcome drug resistance associated with mitochondrial respiratory defect and hypoxia, Cancer Res, Vol. 65, 2005, 613-621
10 G. Sutendra, E.D. Michelakis, Pyruvate dehydrogenase kinase as a novel therapeutic target in oncology, Front. Oncol, Vol. 3, 2013, 38
11 G. Sutendra, P. Dromparis, A. Kinnaird, T.H. Stenson, A. Haromy, J.M. Parker, Mitochondrial activation by inhibition of PDKII suppresses HIF1a signaling and angiogenesis in cancer, Oncogene, Vol. 32, 2013, 1638-1650
12 R.C. Sun, M. Fadia, J.E. Dahlstrom, C.R. Parish, P.G. Board, A.C. Blackburn, Reversal of the glycolytic phenotype by dichloroacetate inhibits metastatic breast cancer cell growth in vitro and in vivo, Breast Cancer Res. Treat, Vol. 120, 2010, 253-260
13 E.D. Michelakis, G. Sutendra, P. Dromparis, L. Webster, A. Haromy, E. Niven, Metabolic modulation of glioblastoma with dichloroacetate, Sci. Transl. Med, Vol. 2, 2010, 31ra34
14 Y.C. Shen, D.L. Ou, C. Hsu, K.L. Lin, C.Y. Chang, C.Y. Lin, Activating oxidative phosphorylation by a pyruvate dehydrogenase kinase inhibitor overcomes sorafenib resistance of hepatocellular carcinoma, Br. J. Cancer, Vol. 108, 2013, 72-81
15 V. Ruggieri, F. Agriesti, R. Scrima, I. Laurenzana, D. Perrone, T. Tataranni, Dichloroacetate, a selective mitochondria-targeting drug for oral squamous cell carcinoma: a metabolic perspective of treatment, Oncotarget, Vol. 6, 2015, 1217-1230
16 M. Nakamura, K. Nakatani, K. Uzawa, K. Ono, H. Uesugi, K. Ogawara, Establishment and characterization of a cisplatin-resistant oral squamous cell carcinoma cell line, H-1R, Oncol. Rep, Vol. 14, 2005, 1281-1286
17 T.C. Chou, Drug combination studies and their synergy quantification using the Chou-Talalay method, Cancer Res, Vol. 70, 2010, 440-446
18 N. Guaragnella, S. Giannattasio, L. Moro, Mitochondrial dysfunction in cancer chemoresistance, Biochem. Pharmacol, Vol. 92, 2014, 62-72
19 S. Ganapathy-Kanniappan, J.F. Geschwind, Tumor glycolysis as a target for cancer therapy: progress and prospects, Mol. Cancer, Vol. 12, 2013, 152
20 Y. Zhou, F. Tozzi, J. Chen, F. Fan, L. Xia, J. Wang, Intracellular ATP levels are a pivotal determinant of chemoresistance in colon cancer cells, Cancer Res, Vol. 72, 2012, 304-314
21 S.P. Pitroda, B.T. Wakim, R.F. Sood, M.G. Beveridge, M.A. Beckett, D.M. MacDermed, STAT1-dependent expression of energy metabolic pathways links tumour growth and radioresistance to the Warburg effect, BMC Med, Vol. 7, 2009, 68
22 B. Bhattacharya, S.H. Low, C. Soh, N. Kamal Mustapa, M. Beloueche-Babari, K.X. Koh, Increased drug resistance is associated with reduced glucose levels and an enhanced glycolysis phenotype, Br. J. Pharmacol, Vol. 171, 2014, 3255-3267
23 S. Kankotia, P.W. Stacpoole, Biochim. Biophys. Acta, Vol. 1846, 2014, 617-629
24 J.W. Kim, I. Tchernyshyov, G.L. Semenza, C.V. Dang, HIF-1-mediated expression of pyruvate dehydrogenase kinase: a metabolic switch required for cellular adaptation to hypoxia, Cell Metab, Vol. 3, 2006, 177-185
25 Y. Sun, A. Daemen, G. Hatzivassiliou, D. Arnott, C. Wilson, G. Zhuang, Metabolic and transcriptional profiling reveals pyruvate dehydrogenase kinase 4 as a mediator of epithelial-mesenchymal transition and drug resistance in tumor cells, Cancer Metab, Vol. 2, 2014, 20
26 C.W. Lu, S.C. Lin, C.W. Chien, S.C. Lin, C.T. Lee, B.W. Lin, Overexpression of pyruvate dehydrogenase kinase 3 increases drug resistance and early recurrence in colon cancer, Am. J. Pathol, Vol. 179, 2011, 1405-1414
27 W. Sun, S. Zhou, S.S. Chang, T. McFate, A. Verma, J.A. Califano, Mitochondrial mutations contribute to HIF1alpha accumulation via increased reactive oxygen species and up-regulated pyruvate dehydrogenease kinase 2 in head and neck squamous cell carcinoma, Clin. Cancer Res, Vol. 15, 2009, 476-484
28 S. Bonnet, S.L. Archer, J. Allalunis-Turner, A. Haromy, C. Beaulieu, R. Thompson, channel axis is suppressed in cancer and its normalization promotes apoptosis and inhibits cancer growth, Cancer Cell, Vol. 11, 2007, 37-51
29 J.G. Pastorino, J.B. Hoek, N. Shulga, Activation of glycogen synthase kinase 3beta disrupts the binding of hexokinase II to mitochondria by phosphorylating voltage-dependent anion channel and potentiates chemotherapy-induced cytotoxicity, Cancer Res, Vol. 65, 2005, 10545-10554
30 L.H. Stockwin, S.X. Yu, S. Borgel, C. Hancock, T.L. Wolfe, L.R. Phillips, Sodium dichloroacetate selectively targets cells with defects in the mitochondrial ETC, Int. J. Cancer, Vol. 127, 2010, 2510-2519
31 E.J. Sullivan, M. Kurtoglu, R. Brenneman, H. Liu, T.J. Lampidis, Targeting cisplatin-resistant human tumor cells with metabolic inhibitors, Cancer Chemother. Pharmacol, Vol. 73, 2014, 417-427
32 S. Shahrzad, K. Lacombe, U. Adamcic, K. Minhas, B.L. Coomber, Sodium dichloroacetate (DCA) reduces apoptosis in colorectal tumor hypoxia, Cancer Lett, Vol. 297, 2010, 75-83
33 D. Heshe, S. Hoogestraat, C. Brauckmann, U. Karst, J. Boos, C. Lanvers-Kaminsky, Dichloroacetate metabolically targeted therapy defeats cytotoxicity of standard anticancer drugs, Cancer Chemother. Pharmacol, Vol. 67, 2011, 647-655
34 J. Xie, B.S. Wang, D.H. Yu, Q. Lu, J. Ma, H. Qi, Dichloroacetate shifts the metabolism from glycolysis to glucose oxidation and exhibits synergistic growth inhibition with cisplatin in HeLa cells, Int. J. Oncol, Vol. 38, 2011, 409-417
35 S. Dhar, S.J. Lippard, Mitaplatin, a potent fusion of cisplatin and the orphan drug dichloroacetate, Proc. Natl. Acad. Sci. U.S.A., Vol. 106, 2009, 22199-22204
36 X. Xue, S. You, Q. Zhang, Y. Wu, G.Z. Zou, P.C. Wang, Mitaplatin increases sensitivity of tumor cells to cisplatin by inducing mitochondrial dysfunction, Mol. Pharm, Vol. 9, 2012, 634-644
37 K. Birsoy, R. Possemato, F.K. Lorbeer, E.C. Bayraktar, P. Thiru, B. Yucel, Metabolic determinants of cancer cell sensitivity to glucose limitation and biguanides, Nature, Vol. 508, 2014, 108-112
38 M.G. Vander Heiden, L.C. Cantley, C.B. Thompson, Understanding the Warburg effect: the metabolic requirements of cell
Related content: