Yong Won Choi1, In Kyoung Lim *
1 Department of Biochemistry and Molecular Biology, BK21 Cell Transformation and Restoration Project, Ajou University School of Medicine, Suwon 443-721, Republic of Korea
* Department of Biochemistry & Molecular Biology, Ajou University School of Medicine, San 5 Woncheon-dong, Yeongtonggu, Suwon 443-721, Republic of Korea; Tel.: +82 31 219 5051; fax: +82 31 219 5059. E-mail address: [email protected] (I.K. Lim).
Received: 29 October 2013
Accepted: 20 January 2014
Revised: in revised form 8 January 2014
Published/Available online: 27 January 2014
Abstract
To investigate sensitization of metformin-cytotoxicity, cancer cells were treated with dichloroacetate (DCA), an inhibitor of pyruvate dehydrogenase kinase (PDK). Metformin-cytotoxicity was mainly dependent on glucose availability and reducing power generated by pentose phosphate pathway, whereas DCA cotreatment enhanced metformin-cytotoxicity via reprogramming glucose metabolism by inhibiting PDK and increasing mitochondrial respiration. DCA cotreatment elicited cell death rather than cell survival despite high glucose and high GSH condition. In conclusion, DCA sensitized metformin-cytotoxicity by reprogramming glucose metabolism in part from aerobic glycolysis to mitochondrial oxidation, evidenced by measurements of glucose consumption, lactate release, and the ratio of oxygen consumption rate/extracellular acidification rate.
Keywords: Metformin Dichloroacetate (DCA), Oxidative stress, Glucose deprivation, Glutathione contents
© 2014 Published by Elsevier Ireland Ltd.
INTRODUCTION
Growing evidences indicate that metabolic perturbations of cancer cells such as aerobic glycolysis or glutamine addiction are inevitable for carcinogenesis beyond the epiphenomenon [13], [31], and enormous amount of efforts have been exhausted to find out drug-able targets and candidate chemicals on cancer metabolism [5], [30]. Based on the epidemiological, preclinical and clinical data, metformin, a biguanide used for treatment of diabetes mellitus, became one of the most attractive and promising drugs targeting for cancer metabolism. Although the mechanism of metformin is not fully elucidated, intracellular function of metformin has been known to inhibit respiratory chain complex I [8], [21]. At present, many evidences indicate that AMPK activation is a master node of anti-tumor effects of metformin [3], [16],[23], therefore, LKB1−/− cancer cells are more resistant to metformin-induced cytotoxicity in the in vitro culture system [22], [34]. In contrast, AMPK activation has been shown to protect cancer cells from energy stress via regulation of NADPH homeostasis [12], therefore, LKB1−/− cancer cells are more sensitive to phenformin-induced metabolic stress in mouse lung cancer model [24]. In the confusing contexts, there are reports that anti-tumor effects metformin are dependent on glucose concentration in culture medium [11], [17], [25]; Glucose-deprivation significantly enhances metformin-cytotoxicity [17], whereas metformin-induced AMPK activation is inefficient under high glucose (25 mM) condition [25]. Therefore, in-depth understanding of biochemical mechanism of metformin-cytotoxicity needs to be clarified before using metformin as an anticancer agent focusing on glucose metabolism.
Warburg effect frequently observed in cancer cells is important not only for energy generation but also for maintaining reduced status under hostile tumor microenvironment. Glucose is the main source of reducing power, NADPH, via pentose phosphate pathway [1], [9], [22]. Indeed, 2-deoxyglucose (2DG)-mediated cancer cell death is dependent mainly on the intolerable oxidative stress in addition to energy crisis [15]. Based on the concept that increased glycolysis protects cancer cells from oxidative stress, metformin-increased glycolysis has been thought to be capable of protecting cells from mitochondrial oxidative stress resulting from the inhibition of respiratory chain complex I [35]. Therefore, we investigated whether metformin-induced mitochondrial stress can be augmented by oxidative stress due to GSH depletion under glucose deprivation or H2O2 treatment under glucose-sufficient condition. Based on the reports that inhibition of glycolysis by 2-DG enhances cytotoxic effects of metformin [2], [6], [14] and that dichloroacetate (DCA) reduces glycolysis by activating pryruvate dehydrogenase (PDH) [32] along with oxidative metabolism and antitumor activity [20].
We explored in the present study the effects of DCA on the metformin-cytotoxicity and the regulation of glucose metabolism. As opposed to the effects of metformin alone, the combined treatment of cancer cells with metformin and DCA significantly enhanced PDH activity, but not glycolysis, thus recovered mitochondrial respiration in cancer cells. The reprogramming of glucose metabolism was tightly associated with severe oxidative stress. In summary, DCA-mediated reprogramming of aerobic glycolysis to mitochondrial oxidation augmented metformin-induced mitochondrial and cellular redox stress that was sufficient to induce massive cell death despite high glucose level.
Materials and methods
Cells and reagents
HeLa, MCF7 and MDA-MB-231 cells were grown in DMEM (Gibco) containing glucose (0–25 mM) supplemented with 10% fetal bovine serum and 100 U/mL gentamycin at 37 °C and 5% CO2. Metformin, dichloroacetate(DCA), l-buthionine-sulfoximine (BSO), H2O2, glutathione monoethyl ester (GSH-MEE) and N-acetyl-l-cysteine (NAC) were obtained from Sigma Chemical Co. (St. Louis, MO). Trolox was from Biomol International, L.P., and 2′,7′-dichlorodihydrofluorescein diacetate (H2DCFDA), MitoSOX Red, propidium iodide (PI) and Calcein AM were obtained from Molecular Probes (Eugene, OR).
Measurement of cell viability and soft agar colony forming assay
Cell viability after various treatments for indicated times was assessed by trypan blue dye exclusion (Sigma–Aldrich). For the assay, 4 × 10⁴ cells were plated in 12-well plates and treated with chemicals the next day. Cells were trypsinized and mixed with 0.4% trypan blue (1:1). Percentage of viable cells represents the number of unstained cells/number of total cells × 100. Cell death was also measured by lactate dehydrogenase (LDH) release assay kit according to the manufacture’s protocol (Takara, Japan). For soft agar colony-forming assay, HeLa cells (1.5 × 10³) were plated in 0.6% agarose solution and layered on 1.0% agarose bed before treatment with different concentrations of metformin, DCA or both in combination. Colonies larger than 125 μm in 2 weeks were counted as positive.
Measurement of cellular ROS levels
Intracellular and mitochondrial ROS were measured by using oxidation sensitive fluorescent probe dichlorodihydroflourescin diacetate (H2DCF-DA) and MitoSOX Red (Invitrogen), respectively. HeLa cells treated with metformin, DCA or both for indicated times were incubated with DCF-DA (20 μM) or MitoSOX (5 μM) for 10 min at 37 °C. Then, the cells were washed twice with phosphate buffered saline (PBS) and subjected to flow cytometry (BD FACSCanto II, BD Biosciences, San Jose, CA) for acquisition and analysis. The fluorescence intensity was determined also by fluorescence microscopy.
Measurement of cellular glutathione levels
To determine redox status of intracellular glutathione, reduced and oxidized glutathione (GSH, GSSG) levels were analyzed according to the method described previously [29]. To determine total glutathione, cells were harvested and suspended in 1% sulfosalicylic acid. After removing the aggregates by centrifugation at 8000g for 10 min, the supernatants were applied for assay. The reaction was started by adding the supernatant (1 μg) to a 96-well microtiter plate containing 200 μl of assay mixture [125 mM NaPO4, pH 7.5, 0.3 mM NADPH, 6 mM 5,50-dithiobis(2-nitrobenzoic acid) (DNTB; Sigma, St. Louis, MO), 0.12 U glutathione reductase], and maximum reduction rate of DNTB by GSH was obtained by measuring absorbance at 405 nm. The amount of total glutathione was calculated from the calibration curve using standard GSH (Sigma). To obtain the level of GSSG, cells were pretreated with 2-vinylpyridine to deprive existing GSH, and the supernatant (50 μg) was processed according to the same protocol as that for total glutathione.
Assay of pyruvate dehydrogenase (PDH) activity
PDH activity was measured by using the PDH Enzyme Activity Microplate Assay Kit (Abcam, Cambridge, MA) according to the protocol. Cells were lysed in the sample buffer provided with the kit, and total cellular protein at a concentration of 5 mg/ml was loaded in triplicate on the capture anti-PDH antibody precoated microplate and incubated for 3 h at room temperature. After washing the samples, reaction mixture was added, and the absorbance of reaction product of the reporter dye-coupled reduction of NAD+ to NADH was measured at 450 nm for 50 min at 0.5 min intervals using Eon Microplate Spectrophotometer (BioStack, Winooski, VT). PDH activity was calculated from the slope of the mOD per time (min) curve (ΔmOD/min) and normalized to the control group.
Glucose consumption and lactate production analysis
Hela cells (1 × 10⁴/ml) cultured in DMEM with 25 mM glucose were treated with metformin, DCA or both. After 48 h, glucose and lactate concentrations in the media were measured by YSI 7100 multiparameter bioanalytical system. Media without cell culture were used for measurement of initial glucose and lactate concentration. Glucose consumption = (glucose concentration of media without cell culture) – (glucose concentration of media from treated group). Lactate production = (lactate concentration of media from treated group) – (lactate concentration of media without cell culture).
Measuring the rates of oxidative phosphorylation and glycolysis
Oxygen consumption rate (OCR) and extracellular acidification rate (ECAR) were measured by using a Seahorse Bioscience (North Billerica, MA) XF24 extracellular flux analyzer [33]. Thus, HeLa cells were seeded in XF 24-well microplates (1 × 10⁴) and incubated at 37 °C for 24 before treatment with metformin, DCA or both for 12 h. Subsequently, cells were washed and equilibrated with DMEM supplemented with GlutaMax-1 (200 mM), glucose (25 mM), sodium chloride (32 mM) and phenol red wtithout bicarbonate at 37 °C for 1 h in an incubator without CO2. The OCR (pmol/min) and ECAR (mpH/min) were measured 3 times for 3 min each. After the experiment, the number of cells was counted for normalization.
Immunoblot analysis
Cell lysates (40 μg) prepared in RIPA buffer with phosphatase inhibitors were separated on SDS–PAGE before transfer to PVDF membrane (Millipore Corp). Blots were hybridized with primary antibodies and visualized by ECL system (Amersham Biosciences, Buckinghamshire, UK). The antibodies were purchased, anti-p-PDH (S293) from Calbiochem, anti-PARP and anti-PDH from Abcam, anti-Caspase 3 from Cell signaling, anti-cyclin D1, anti-cyclin E and anti-β-actin from Santa Cruz Biotechnology.
Statistical analysis
Numerical data were presented as mean ± SD of the independent determinations. Independent t-test or ANOVA was applied, and multiple comparisons were evaluated by Tukey HSD. P values less than 0.05 were considered as significant.
Results
Metfromin-cytotoxicity is recovered by glucose available
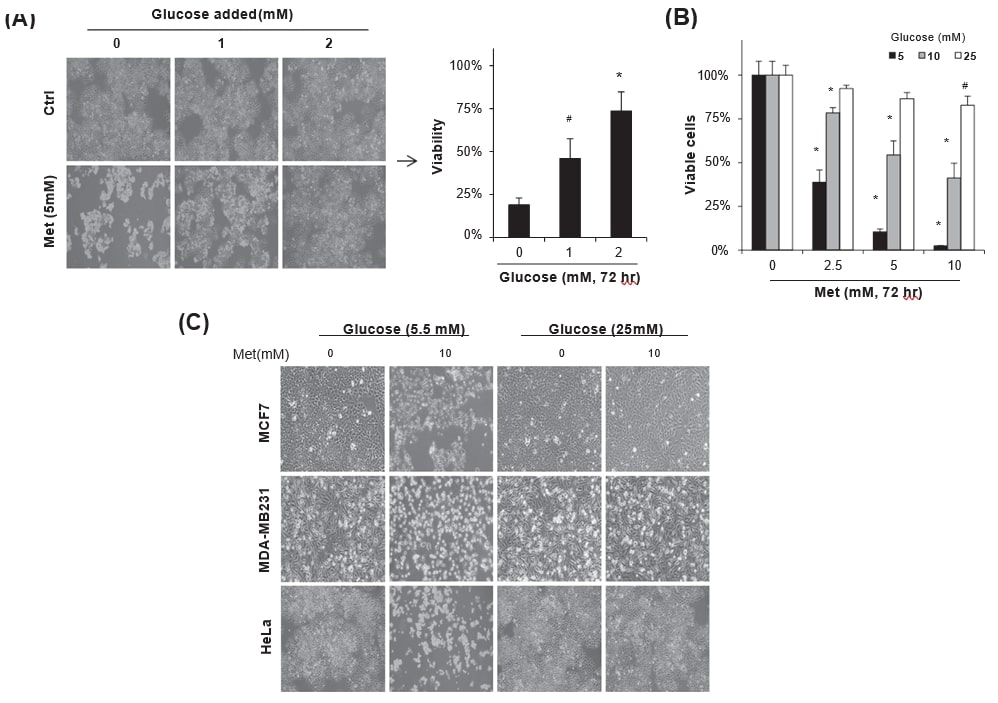
To understand biochemical pathways regulating metformin-induced cancer cell death, HeLa cells maintained in DMEM with 5.5 mM glucose were treated with metformin (5 mM) along with daily addition of glucose (0–2 mM) for 72 h. Glucose supplementation significantly increased viability of the cells treated with metformin (Fig. 1A, #p < 0.05 and *p < 0.001 vs. no addition) in good accordance with previous reports [11], [17], [25]. When HeLa cells maintained in the media containing 5–25 mM glucose were incubated with 0–10 mM metformin for 72 h, the metformin-induced cell death was dependent on the concentration of glucose in culture media. Especially, high glucose (25 mM) condition significantly protected metformin-cytotoxicity regardless of metformin concentration (Fig. 1B). The cell death induced by 10 mM metformin was protected by 25 mM glucose in the culture media not only in HeLa cells but also in MCF7 and MDA-MB231 breast cancer cells, whereas 5.5 mM glucose failed to protect the cells from the toxic effect (Fig. 1C), observed under phase contrast microscope. The results indicate that the balance between the concentrations of metformin and glucose in culture media is important for the regulation of metformin-cytotoxicity.
Metformin-cytotoxicity is regulated by GSH-mediated redox changes
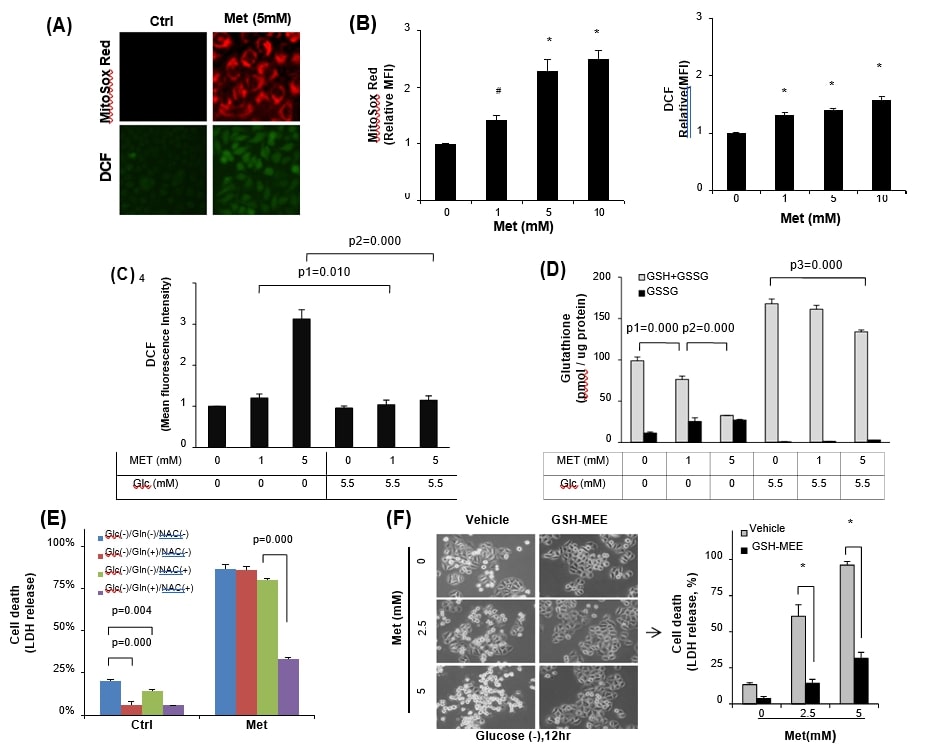
Since metformin increases mitochondrial ROS level through inhibiting respiratory chain complex I [8], [21], [36], we, therefore, explored whether metformin-induced mitochondrial oxidative stress was severe enough to induce cancer cell death under glucose-insufficient condition. HeLa cells maintained in the glucose containing media were treated with 5 mM metformin, and then mitochondrial superoxide and total cellular ROS levels were evaluated by using MitoSox Red and DCFDA, respectively (Fig. 2A). Indeed, metformin increased mitochondrial and total cellular ROS levels in metoformin-concentration-dependent manner, however, fluorescence of MitoSox Red was mostly higher than that of total cellular ROS level in HeLa cells (Fig. 2B). As expected, the metformin-induced cellular ROS level was significantly increased in the glucose free condition than the glucose containing media (Fig. 2C). These data strongly support the report [15] that glucose deprivation reduces cellular glutathione pool (GSH + GSSG). Therefore, when the glutathione pool was measured, the reduction of GSH relative to GSSG was more significant in the glucose-free condition (p = 0.000) in response to metformin, however, total glutathione content was maintained without significant GSSG increase in the glucose (5.5 mM) containing media (Fig. 2D), indicating that glucose in the culture media played as an important source of GSH generation. To investigate the regulation of metformin-cytotoxicity by redox stress under glucose deprivation, antioxidants were employed. Treatment of HeLa cells with either 10 mM glutamine or N-acetyl-l-cysteine (NAC) alone significantly reduced cell death observed in the glucose-free media without metformin addition (Fig. 2E, p = 0.000 and p = 0.004 vs. no treatment, respectively), however, the same treatment failed to ameliorate metformin (5 mM)-cytotoxicity in the glucose-free media. On the other hand, combined treatment of glutamine with NAC could protect HeLa cells from the metformin (5 mM)-cytotoxicity (Fig. 2E, p = 0.000). To directly confirm whether reduced glutathione played a role in the inhibition of metformin-cytotoxicity, cell-permeable form of GSH (GSH-MEE) was employed. Addition of GSH-MEE significantly reduced HeLa cell death, compared to those of vehicle control even in the glucose-free condition (Fig. 2F). The data reveals synergistic effect of glucose deprivation in the metformin-cytotoxicity via oxidative stress by depletion of GSH.
Augmentation of oxidative stress aggravates metformin-cytotoxicty despite high glucose level
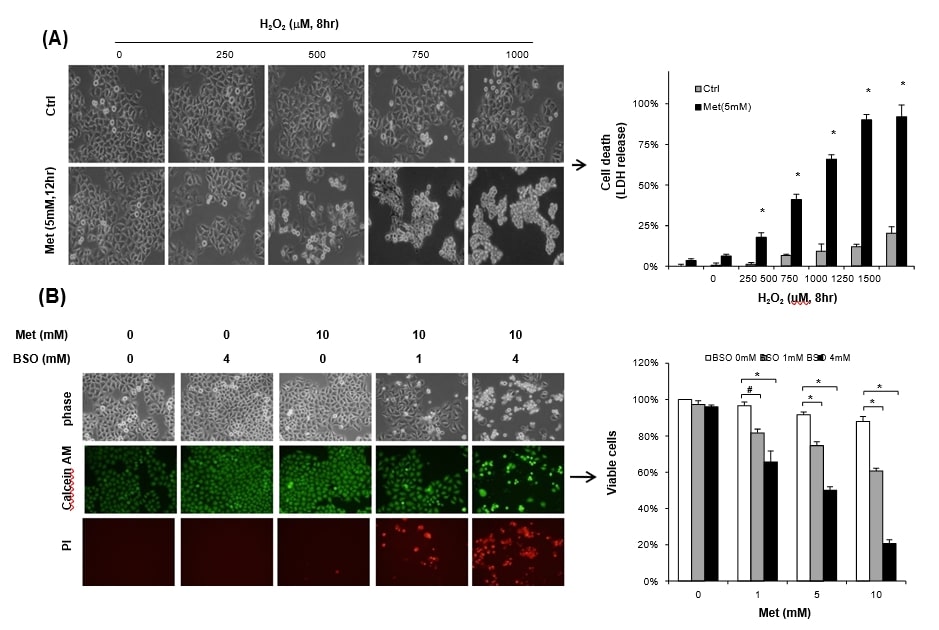
To ensure whether the cells exposed to metformin become more vulnerable to stress, HeLa cells maintained with 25 mM glucose were treated with 5 mM metformin along with H2O2 for 12 h. Single treatment with either H2O2 or 5 mM metformin failed to induce significant cell death, however, combined treatment of metformin with H2O2 (over 500 μM) markedly increased cell death, measured by LDH release (Fig. 3A). Not only exogenous H2O2 but also depletion of glutathione pool by BSO, inhibitor of GSH synthesis, also resulted in significant level of metformin-cytotoxicity. Incubation with either metformin (10 mM) or 4 mM BSO alone for 48 h failed to show significant sign of cell death under high glucose (25 mM) condition when evaluated by Calcein AM staining (Fig. 3B left panel). However, combined treatment of metformin with BSO significantly increased propidium iodide positive cell death, when it was monitored by trypan blue exclusion. BSO (1 mM) significantly sensitized 1 mM metformin-cytotoxicity under the high glucose (25 mM) condition (Fig. 3B right panel). Our findings are well supported by earlier studies that GSH is the most abundant and important biological antioxidant against oxidative stress in cancer cells [7], [10].
Dichloroacetate enhances mitochondrial respiration via activating pyruvate dehydrogenase
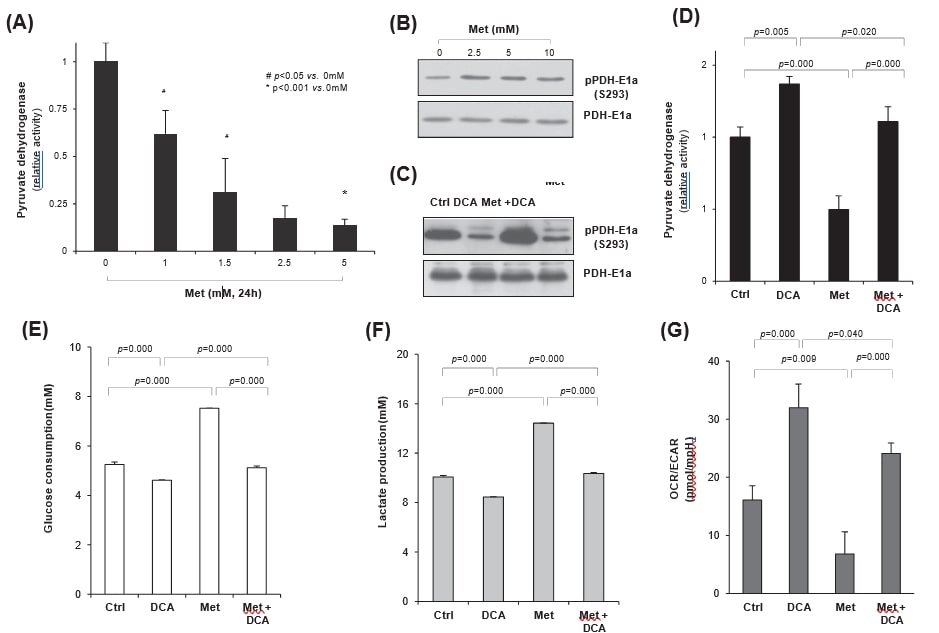
Since PDH determines fate of glucose metabolism either in mitochondira or cytosol, it is highly likely that enhancing PDH activity might increase mitochondrial respiration rather than aerobic glycolysis in cancer cells. Therefore, we investigated whether metformin-induced glycolysis was regulated by DCA, an inhibitor of PDH kinase (PDK). When HeLa cells were treated with metformin, PDH activity was significantly decreased in the dose dependent manner (Fig. 4A). Meformin treatment clearly increased PDH-E1a phosphorylation, indicating PDK activation as opposed to PDH inhibition (Fig. 4B). On the other hand, DCA treatment significantly reduced metformin-induced PDH-E1a phosphorylation on S293 residue independent on metformin treatment, resulting in the increase or maintenance of PDH activity by DCA (Fig. 4C). Indeed, DCA significantly increased PDH activity (p = 0.005), in contrast to the significant inhibition by metformin (p = 0.000), compared with the control. Moreover, cotreatment of DCA with metformin significantly recovered the metformin-inhibited PDH activity (p = 0.000) up to the control level (Fig. 4D); DCA antagonized metformin effect on PDH activity. To evaluate the regulation of metabolic changes by DCA or metformin, the rates of glucose consumption and lactate production were measured in culture media; DCA treatment significantly reduced glucose consumption (p = 0.000), as opposed to significant increase by metformin (p = 0.000, Fig. 4E). However, the change was insignificant by metformin plus DCA cotreatment (p = 0.125 vs. control), again confirming the antagonistic relationship between DCA and metformin. Moreover, lactate release (Fig. 4F) by either DCA or metformin alone revealed the same pattern as those of the glucose consumption rate (Fig. 4E), suggesting the change of glucose metabolism from metformin-induced aerobic glycolysis to mitochondrial oxidation by DCA cotreatment. When oxygen consumption rate (OCR) and extracellular acidification rate (ECAR) were measured by XF24 analyzer, ratio of OCR/ECAR was significantly increased by DCA treatment (p = 0.000), representing increased mitochondrial respiration, but decreased by metformin (p = 0.009) than the control. Indeed, cotreatment of metformin with DCA significantly recovered mitochondrial respiration compared with the metformin alone (p = 0.000), even though it was a little lower than the DCA alone (p = 0.04). Taken together, cotreatment of metformin with DCA reprogrammed glucose metabolism in part from aerobic glycolysis to mitochondrial oxidation (Fig. 4G).
Dichloroacetate augments oxidative stress and metformin-cytotoxicity under high glucose condition
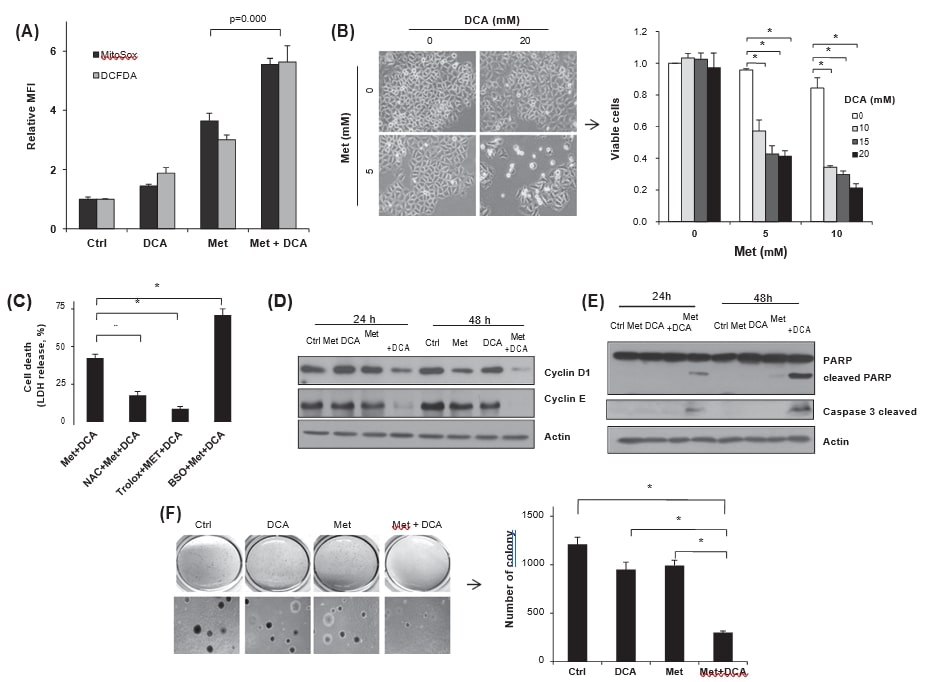
To investigate the effect of DCA-mediated metabolic reprogramming on cellular ROS level, FACS analyses using MitoSox Red and DCFDA were employed. The cotreatment of HeLa cells with metformin and DCA increased both mitochondrial superoxide and total cellular ROS levels than that of each treatment (Fig. 5A), suggesting that metabolic reprogramming might aggravate oxidative stress by DCA. To evaluate whether the DCA-enhanced ROS generation augments metformin-cytotoxicity or not, cell viability after treatment with metformin, DCA or both was counted. As opposed to negligible level of cell death by DCA alone (∼20 mM), cotreatment of DCA with metformin markedly reduced the viabilities despite high glucose condition (Fig. 5B). To evaluate effect of the increased ROS on the cell death, antioxidants, NAC or trolox, or a prooxidant, BSO, were pretreated before metformin and DCA cotreatment. Indeed, the antioxidants significantly reduced LDH release in to media, whereas it was increased by BSO pretreamtnet (Fig. 5C), indicating significant regulation of metformin-cytotoxicity via modulating oxidative stress by DCA. Such synergistic effect of the cytotoxicity was also observed in other cancer cells, MDA-MB-231, EJ and MCF7 (data not shown). Moreover, cotreatment of metformin and DCA significantly inhibited cyclin D1 and cyclin E synthesis along with PARP cleavage (Fig. 5D and E), indicating reduced cell proliferation and apoptosis induction. Finally, the cotreatment significantly reduced anchorage-independent growth of HeLa cells than those of the single treatments and the control (Fig. 5F).
Discussion
We presented evidences that reprogramming of glucose metabolism by treatment of HeLa cells with meformin and dicholoroacetate enhanced cell death through upregulating ROS level by increasing mitochondrial oxidation rather than aerobic glycolysis (Fig. 6). DCA was employed as an agent to promote oxidative phosphorylation over the glycolysis and intended to reprogram metformin-mediated glucose metabolism. DCA activates PDH via inhibition of PDK, thus pyruvate can be converted to acetyl-CoA instead of lactate. As a biochemical mechanism of glucose deprivation-induced sensitization of cancer cells to metformin- cytotoxicity, we demonstrated that oxidative stress induced by metformin was aggravated under glucose-deprived condition (Fig. 2C). Indeed, metformin consumed glutathione much more than the basal usage (Fig. 2D), whereas it was much less in the presence of glucose (5.5 mM). Although pretreatment of HeLa cells with NAC significantly blocked cell death uder glucose-free condition, cysteine supplement by NAC without glutamine was insufficient to maintain glutathione level to endure metformin-induced oxidative stress (Fig. 2E). The phenomenon can be supported by the study that glutamine is important for reductive carboxylation in tumor cells with defective mitochondria [19]. Therefore, supplement of NAC with glutamine significantly reduced metformin-cytotoxicity under the glucose free condition (Fig. 2E).
Under high glucose (25 mM) condition, 10 mM metformin exhibited only mild tumoristatic effect, but not significant cell death (Fig. 3B). In contrast, 2.5 mM metformin induced significant cell death under 5.5 mM glucose concentration (Fig. 1B), indicating glucose as an important source of reducing power. Therefore, supplementation with 1–2 mM glucose was sufficient to block the metformin-cytotoxicity under the usual glucose level (Fig. 1A), suggesting that metformin-cytotoxicy might be insufficient to induce cell death under physiologic glucose condition. However, metformin treatment significantly increased mitochondrial ROS in the glucose no-limitation condition. There is yet no report focused on the mitochondrial ROS generation in the context of metformin-cytotoxicity. Here, we observed that 1 mM metformin already significantly increased mitochondrial superoxide along with cellular ROS (Fig. 2B), which induced mitochondrial swelling in cancer cells and the swelling was not irreversible (Supplementary Figs. S1A and S1B). Nevertheless, the increased mitochondrial ROS does not seem to be sufficient to increase total cellular ROS and oxidative damage. Cancer cells exposed to metformin try to minimize oxidative damage to maintain cell viability through the inductions of aerobic glycolysis and NADPH production. The notion can be partly supported by the fact that depletion of reducing power by BSO or exogenous H2O2 augmented metformin-cytotoxicity despite the high glucose condition (Fig. 3). Cancer cells can stand for oxidative stress through aerobic glycolysis and the extent of GSH can be maintained mainly by NADPH produced via pentose phosphate pathway [12].
Anti-tumor activity of DCA has been shown in vitro [4] and in vivo mouse models [27], [28], and in the glioblastoma patients [18], however, IC50 value of DCA is relatively high (>17 mM, 48 h) to induce cell death. Moreover, there is no tumor cell specificity in the cancer cell lines tested [26], and DCA is selectively active against cells with defect in mitochondria such as rho(0) cells or HCT116 p53 null cells with complex IV deficiency. We also observed that 20 mM DCA alone failed to induce effective cell death, however, combined with metformin synergized anti-tumor activity of DCA with 10 mM (Fig. 5B and F).
When cells were treated with metformin, PDH activity was significantly inhibited through its phospholytation on Ser293 residue (Fig. 4C) without any significant change of PDK mRNA expression (data not shown), indicating the posttranscriptional modification. Although we were unable to define the mechanism of metformin-induced inhibition of PDH activity, the decrease of PDK activity by DCA enhanced metformin-induced oxidative stress by repressing PDH phosphorylation (Fig. 4), indicating the inhibition of PDK activity by DCA, but increase of oxidative phosphorylation along with redox stress. In agreement with the above finding, DCA significantly restored metformin-inhibited mitochondrial respiration in part (Fig. 4F) and highly augmented mitochondrial ROS generation induced by metformin (Fig. 5A). The protective role of antioxidants against the combined treatment of metformin and DCA led us to conclude that DCA can potentiate metformin-cytotoxicity through reprogramming and enhancing oxidative stress (Fig. 5C).
In summary, the metformin-induced cytotoxicity was enhanced by glucose deprivation. Even in high glucose condition, additional ROS stress by depletion of GSH or exogenous H2O2 insult augmented metformin-cytotoxicity along with increased mitochondrial respiration. We conclude that DCA-mediated reprogramming of glucose metabolism from aerobic glycolysis to oxidative respiration aggravates metformin-induced oxidative stress and sensitizes metformin-cytotoxicity in cancer cells (Fig. 6).

Conflict of interest
There is no competing financial interest related to this work.
Acknowledgements
This work was supported by a grant from the National R&D Program for Cancer Control, Ministry for Health and Welfare, Republic of Korea (131280).
Appendix A. Supplementary material
Supplementary data associated with this article can be found, in the online version, at http://dx.doi.org/10.1016/j.canlet.2014.01.015.
REFERENCES
1 I.M. Ahmad, N. Aykin-Burns, J.E. Sim, S.A. Walsh, R. Higashikubo, G.R. Buettner, S. Venkataraman, M.A. Mackey, S.W. Flanagan, L.W. Oberley, D.R. Spitz Mitochondrial O2*- and H2O2 mediate glucose deprivation-induced stress in human cancer cells J. Biol. Chem., 280 (2005), pp. 4254-42632 I. Ben Sahra, K. Laurent, S. Giuliano, F. Larbret, G. Ponzio, P. Gounon, Y. Le Marchand-Brustel, S. Giorgetti-Peraldi, M. Cormont, C. Bertolotto, M. Deckert, P. Auberger, J.F. Tanti, F. Bost Targeting cancer cell metabolism: the combination of metformin and 2-deoxyglucose induces p53-dependent apoptosis in prostate cancer cells Cancer Res., 70 (2010), pp. 2465-2475
3 I. Ben Sahra, Y. Le Marchand-Brustel, J.F. Tanti, F. Bost Metformin in cancer therapy: a new perspective for an old antidiabetic drug? Mol. Cancer Ther., 9 (2010), pp. 1092-1099
4 S. Bonnet, S.L. Archer, J. Allalunis-Turner, A. Haromy, C. Beaulieu, R. Thompson, C.T. Lee, G.D. Lopaschuk, L. Puttagunta, S. Bonnet, G. Harry, K. Hashimoto, C.J. Porter, M.A. Andrade, B. Thebaud, E.D. Michelakis A mitochondria-K+ channel axis is suppressed in cancer and its normalization promotes apoptosis and inhibits cancer growth Cancer Cell, 11 (2007), pp. 37-51
5 J.R. Cantor, D.M. Sabatini Cancer cell metabolism: one hallmark, many faces Cancer Discov., 2 (2012), pp. 881-898
6 J.H. Cheong, E.S. Park, J. Liang, J.B. Dennison, D. Tsavachidou, C. Nguyen-Charles, K. Wa Cheng, H. Hall, D. Zhang, Y. Lu, M. Ravoori, V. Kundra, J. Ajani, J.S. Lee, W. Ki Hong, G.B. Mills Dual inhibition of tumor energy pathway by 2-deoxyglucose and metformin is effective against a broad spectrum of preclinical cancer models Mol. Cancer Ther., 10 (2011), pp. 2350-2362
7 E.P. Clark, E.R. Epp, J.E. Biaglow, M. Morse-Gaudio, E. Zachgo Glutathione depletion, radiosensitization, and misonidazole potentiation in hypoxic Chinese hamster ovary cells by buthionine sulfoximine Radiat. Res., 98 (1984), pp. 370-380
8 M.Y. El-Mir, V. Nogueira, E. Fontaine, N. Averet, M. Rigoulet, X. Leverve Dimethylbiguanide inhibits cell respiration via an indirect effect targeted on the respiratory chain complex I J. Biol. Chem., 275 (2000), pp. 223-228
9 R.B. Hamanaka, N.S. Chandel Cell biology. Warburg effect and redox balance Science, 334 (2011), pp. 1219-1220
10 T. Ishimoto, O. Nagano, T. Yae, M. Tamada, T. Motohara, H. Oshima, M. Oshima, T. Ikeda, R. Asaba, H. Yagi, T. Masuko, T. Shimizu, T. Ishikawa, K. Kai, E. Takahashi, Y. Imamura, Y. Baba, M. Ohmura, M. Suematsu, H. Baba, H. Saya CD44 variant regulates redox status in cancer cells by stabilizing the xCT subunit of system xc(-) and thereby promotes tumor growth Cancer Cell, 19 (2011), pp. 387-400
11 S. Javeshghani, M. Zakikhani, S. Austin, M. Bazile, M.J. Blouin, I. Topisirovic, J. St-Pierre, M.N. Pollak Carbon source and myc expression influence the antiproliferative actions of metformin Cancer Res., 72 (2012), pp. 6257-6267
12 S.M. Jeon, N.S. Chandel, N. Hay AMPK regulates NADPH homeostasis to promote tumour cell survival during energy stress Nature, 485 (2012), pp. 661-665
13 G. Kroemer, J. Pouyssegur Tumor cell metabolism: cancer’s Achilles’ heel Cancer Cell, 13 (2008), pp. 472-482
14 M.A. Lea, J. Chacko, S. Bolikal, J.Y. Hong, R. Chung, A. Ortega, C. Desbordes Addition of 2-deoxyglucose enhances growth inhibition but reverses acidification in colon cancer cells treated with phenformin Anticancer Res., 31 (2011), pp. 421-426
15 X. Lin, F. Zhang, C.M. Bradbury, A. Kaushal, L. Li, D.R. Spitz, R.L. Aft, D. Gius 2-Deoxy-d-glucose-induced cytotoxicity and radiosensitization in tumor cells is mediated via disruptions in thiol metabolism Cancer Res., 63 (2003), pp. 3413-3417
16 L. Luo, W. Huang, R. Tao, N. Hu, Z.X. Xiao, Z. Luo ATM and LKB1 dependent activation of AMPK sensitizes cancer cells to etoposide-induced apoptosis Cancer Lett., 328 (2013), pp. 114-119
17 J.A. Menendez, C. Oliveras-Ferraros, S. Cufi, B. Corominas-Faja, J. Joven, B. Martin-Castillo, A. Vazquez-Martin Metformin is synthetically lethal with glucose withdrawal in cancer cells Cell Cycle, 11 (2012), pp. 2782-2792
18 E.D. Michelakis, G. Sutendra, P. Dromparis, L. Webster, A. Haromy, E. Niven, C. Maguire, T.L. Gammer, J.R. Mackey, D. Fulton, B. Abdulkarim, M.S. McMurtry, K.C. Petruk Metabolic modulation of glioblastoma with dichloroacetate Sci. Translat. Med., 2 (2010), p. 31ra34
19 A.R. Mullen, W.W. Wheaton, E.S. Jin, P.H. Chen, L.B. Sullivan, T. Cheng, Y. Yang, W.M. Linehan, N.S. Chandel, R.J. DeBerardinis Reductive carboxylation supports growth in tumour cells with defective mitochondria Nature, 481 (2012), pp. 385-388
20 M.R. Niewisch, Z. Kuci, H. Wolburg, M. Sautter, L. Krampen, B. Deubzer, R. Handgretinger, G. Bruchelt Influence of dichloroacetate (DCA) on lactate production and oxygen consumption in neuroblastoma cells: is DCA a suitable drug for neuroblastoma therapy? Cell. Physiol. Biochem.: Int. J. Exp. Cell. Physiol., Biochem., Pharmacol., 29 (2012), pp. 373-380
21 M.R. Owen, E. Doran, A.P. Halestrap Evidence that metformin exerts its anti-diabetic effects through inhibition of complex 1 of the mitochondrial respiratory chain Biochem. J., 348 (Pt 3) (2000), pp. 607-614
22 C. Riganti, E. Gazzano, M. Polimeni, E. Aldieri, D. Ghigo The pentose phosphate pathway: an antioxidant defense and a crossroad in tumor cell fate Free Radical Biol. Med., 53 (2012), pp. 421-436
23 G.Z. Rocha, M.M. Dias, E.R. Ropelle, F. Osorio-Costa, F.A. Rossato, A.E. Vercesi, M.J. Saad, J.B. Carvalheira Metformin amplifies chemotherapy-induced AMPK activation and antitumoral growth Clin. Cancer Res.: Official J. Am. Assoc. Cancer Res., 17 (2011), pp. 3993-4005
24 D.B. Shackelford, E. Abt, L. Gerken, D.S. Vasquez, A. Seki, M. Leblanc, L. Wei, M.C. Fishbein, J. Czernin, P.S. Mischel, R.J. Shaw LKB1 inactivation dictates therapeutic response of non-small cell lung cancer to the metabolism drug phenformin Cancer Cell, 23 (2013), pp. 143-158
25 J. Sinnett-Smith, K. Kisfalvi, R. Kui, E. RozengurtMetformin inhibition of mTORC1 activation, DNA synthesis and proliferation in pancreatic cancer cells: dependence on glucose concentration and role of AMPK Biochem. Biophys. Res. Commun., 430 (2013), pp. 352-357
26 L.H. Stockwin, S.X. Yu, S. Borgel, C. Hancock, T.L. Wolfe, L.R. Phillips, M.G. Hollingshead, D.L. Newton Sodium dichloroacetate selectively targets cells with defects in the mitochondrial ETC Int. J. Cancer J. Int. Cancer, 127 (2010), pp. 2510-2519
27 R.C. Sun, M. Fadia, J.E. Dahlstrom, C.R. Parish, P.G. Board, A.C. Blackburn Reversal of the glycolytic phenotype by dichloroacetate inhibits metastatic breast cancer cell growth in vitro and in vivo Breast Cancer Res. Treat., 120 (2010), pp. 253-260
28 G. Sutendra, P. Dromparis, A. Kinnaird, T.H. Stenson, A. Haromy, J.M. Parker, M.S. McMurtry, E.D. Michelakis iMitochondrial activation by inhibition of PDKII suppresses HIF1a signaling and angiogenesis in cancer Oncogene, 32 (2013), pp. 1638-1650
29 F. Tietze Enzymic method for quantitative determination of nanogram amounts of total and oxidized glutathione: applications to mammalian blood and other tissues m8 Anal. Biochem., 27 (1969), pp. 502-522
30 M.G. Vander Heiden Targeting cancer metabolism: a therapeutic window opens Nat. Rev. Drug Discovery, 10 (2011), pp. 671-684
31 P.S. Ward, C.B. Thompson Metabolic reprogramming: a cancer hallmark even warburg did not anticipate Cancer Cell, 21 (2012), pp. 297-308
32 S. Whitehouse, R.H. Cooper, P.J. Randle Mechanism of activation of pyruvate dehydrogenase by dichloroacetate and other halogenated carboxylic acids Biochem. J., 141 (1974), pp. 761-774
33 M. Wu, A. Neilson, A.L. Swift, R. Moran, J. Tamagnine, D. Parslow, S. Armistead, K. Lemire, J. Orrell, J. Teich, S. Chomicz, D.A. Ferrick Multiparameter metabolic analysis reveals a close link between attenuated mitochondrial bioenergetic function and enhanced glycolysis dependency in human tumor cells Am. J. Physiol. Cell Physiol., 292 (2007), pp. C125-136
34 X. Xiao, Q. He, C. Lu, K.D. Werle, R.X. Zhao, J. Chen, B.C. Davis, R. Cui, J. Liang, Z.X. Xu Metformin impairs the growth of liver kinase B1-intact cervical cancer cells Gynecol. Oncol., 127 (2012), pp. 249-255
35 Y. Zhuang, W.K. Miskimins Metformin induces both caspase-dependent and poly(ADP-ribose) polymerase-dependent cell death in breast cancer cells Mol. Cancer Res.: MCR, 9 (2011), pp. 603-615
36 J.W. Zmijewski, E. Lorne, X. Zhao, Y. Tsuruta, Y. Sha, G. Liu, G.P. Siegal, E. Abraham Mitochondrial respiratory complex I regulates neutrophil activation and severity of lung injury Am. J. Respir. Crit. Care Med., 178 (2008), pp. 168-179