Helena Populo1,2, Regina Caldas1,2,3, Jose Manuel Lopes1,2,4,5, Joana Pardal5, Valdemar Maximo1,2,4 & Paula Soares†,2,4
† Institute for Research and Innovation in Health (Instituto de Investigacao e Inovacao em Saude), University of Porto, Porto, Portugal
1 Institute of Molecular Pathology and Immunology of the University of Porto (IPATIMUP), University of Porto, Porto, Portugal
Tel: +22 557 0700; Fax: +22 557 0799; E-mail: [email protected]
2 Institute for Research and Innovation in Health (Instituto de Investigacao e Inovac¸aoem Saude), University of Porto, Porto, Portugal
3 Faculty of Medicine, University of Porto, Porto, Portugal
4 Department of Pathology and Oncology, Faculty of Medicine, University of Porto, Porto, Portugal
5 Service of Anatomic Pathology Hospital Sao Joao, Porto, Portugal
Published Online: 14 May 2015
Abstract
Objective: We aimed to verify if there is evidence to consider dichloroacetate (DCA), which inhibits the pyruvate dehydrogenase kinase (PDK) and reverts the metabolic shift of cancer cells from glycolysis to oxidative phosphorylation, as a promising drug for therapy of cutaneous melanoma (CM) patients.
Research design and methods: We assessed the expression profile of PDK 1, 2 and 3 in a series of melanoma samples, to verify if melanoma tumors express the DCA targets, if this expression correlates with the activation of important signaling cascades for melanomagenesis and also with the prognosis of melanoma patients. We also established the sensitivity of melanoma cell lines to DCA treatment, by assessing their metabolic alterations, proliferation and survival.
Results: We observed that both PDK 1 and 2 isoforms are overexpressed in CM compared to nevi, this expression being associated with the expression of the mTOR pathway effectors and independent of the BRAF mutational status. Melanoma cell lines treated with DCA showed a shift in metabolism, that is, a decrease in glucose consumption and lactate production, downregulation of proliferation, an increase of apoptosis and a decrease in mTOR pathway activation.
Conclusion: Our results suggest that PDK expression may play a role in melanoma development and that DCA can be useful for CM therapy, alone or in combination with mTOR inhibitors.
Keywords: dichloroacetate, melanoma, metabolism, mTOR, pyruvate dehydrogenase kinase
© 2015 Informa UK, Ltd. ISSN 1472-8222, e-ISSN 1744-7631
INTRODUCTION
Cutaneous melanoma (CM) is a very aggressive malignancy, and despite being the least common type of skin cancer, it is responsible for the majority of skin cancerrelated deaths. As the incidence of CM is rising, it is at present the most probable invasive cancer to develop before the age of 50 years in male gender [1,2]. Exposure to UV radiation is considered the main risk factor for melanomagenesis [2]. CM can be classified in different histological subtypes, being the most common superficial spreading melanoma (SSM), followed by nodular melanoma (NM), lentigo maligna melanoma (LMM) and acral lentiginous melanoma (ALM). SSM and NM arise in the skin with intermittent sun exposure, whereas LMM occurs in chronic sundamaged skin and ALM is restricted to skin with no sun exposure. This histological classification has no prognostic value [3,4]. Staging of CM takes into account tumor thickness, ulceration, mitotic rate, node involvement and the presence of metastasis [5]. Fortunately, most cases of CM are diagnosed in an early stage, with a 5-year survival rate reaching 98% [1]. Nevertheless, for patients with metastatic melanoma, the median survival is only 8 – 9 months [5].
CM is a very heterogeneous tumor and many cell-signaling pathways are deregulated in melanomagenesis [6,7]. The MAPK pathway is constitutively activated in the majority of CMs. NRAS mutations were reported in 10 – 20% of CMs, NRASQ61K/R being the most common. BRAF mutations, and in particular the BRAFV600E mutation, were identified in 40 – 60% of cases. Our group observed an association between the presence of BRAF mutations and the recently described TERT promoter mutations in CM [8]. BRAFV600E, and to a lesser extent, NRASQ61K/R mutations were also reported in almost 80% of nevi (benign melanocytic lesions that are considered as precursors of CM in 25% of the cases), indicating that the activation of the MAPK pathway may be necessary but not sufficient for melanoma development [7,9,10]. In fact, BRAFV600E has been related to oncogene-induced senescence and therefore may lead, in many nevi, to a growth-arrest condition [11]. Activation of the PI3K-AKTmTOR pathway may overcome this senescence phenotype and boost tumor progression [12]. Our group has confirmed the importance of the PI3K-AKT-mTOR pathway in CM aggressiveness by associating its activation with the presence of BRAF mutations and worse prognostic features. Indeed, overexpression of mTOR pathway effectors was associated with higher mitotic rate, higher Clark level, increased tumor thickness and the presence of skin ulceration [13].
Before 2011, treatment options for patients with advanced CM relied mainly on conventional chemotherapy, which had low response rates and minor effects in patients’ overall survival (OS). Ever since, five new drugs were approved for stage IV CM patients [14]. Ipilimumab, an anti-CTLA4 antibody, revealed marked improvements in OS of the patients, but its adverse effects turned it not suitable for all patients [15]. Vemurafenib and dabrafenib, selective inhibitors of BRAFV600E, and trametinib, a MEK inhibitor, all target the MAPK pathway and were reported to achieve response rates greater than 50%, even better than those for ipilimumab. However, their improvements in OS do not exceed 7 – 8 months due to the development of resistance [16-18]. Recently, another immune modulator, pembrolizumab, an antibody against the programmed death receptor-1 (PD-1), was approved for the treatment of patients with unresectable or metastatic melanoma and disease progression following ipilimumab or, if BRAFV600 mutation positive, a BRAF inhibitor [19]. Clinical trials with drugs targeting the PI3K-AKT-mTOR pathway are underway [4,14], yet new therapeutic approaches are warranted.
Cancer cell metabolism differs from that of normal cells. In normal cells, depending on O2 availability, glucose can be partially metabolized to lactate through glycolysis in hypoxic conditions, or it can be fully oxidized to CO2 in the presence of O2, through mitochondrial oxidative phosphorylation, a more efficient energetic process. Cancer cells, on the other hand, metabolize most glucose to lactate, regardless of their O2 supply, the so-called Warburg effect [20,21]. The acquisition of this glycolytic phenotype in cancer cells is not fully understood, still an essential role has been recognized for the transcription factor hypoxia-inducible factor 1a (HIF1-α) [22]. HIF1-α protein is known to be stabilized under hypoxia, but oncogenic pathways, such as the MAPK and the mTOR pathways, also seem to mediate its activation in cancer (Figure 1) [22,23]. Strong evidence indicates that CM acquires this glycolytic phenotype, which can be confirmed by FDGPET scanning of patients [24-27]. In fact, HIF1-α appears to be overexpressed in CM, because the skin is a mild-hypoxic environment and the production of melanin indirectly stimulates HIF1-α expression by ROS production [28-30]. Yet, cytoplasmic glycolysis must be uncoupled from the mitochondrial oxidative phosphorylation, so that most pyruvate can be converted into lactate. This last process is driven by pyruvate dehydrogenase kinase (PDK), an enzyme upregulated by HIF1-α (Figure 1) [31,32].
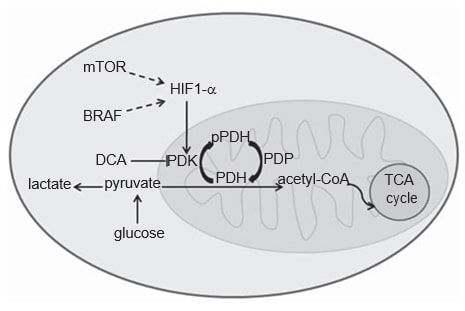
PDK is an element of the mitochondrial pyruvate dehydrogenase complex (PDC). PDC comprises the pyruvate dehydrogenase (PDH) enzyme and its regulatory proteins: PDK that by phosphorylating PDH acts as an inhibitor, and pyruvate dehydrogenase phosphatase that activates PDH by dephosphorylation [33]. Dephosphorylated PDH catalyzes the oxidative decarboxylation of pyruvate into acetyl-CoA, CO2 and NADH (H+ ), thereby linking the glycolytic pathway to the oxidative pathway of tricarboxylic acid cycle (Figure 1) [33]. There are four isoforms of PDK (1, 2, 3, 4) which differ in their intrinsic activity, tissue distribution and sensitivity to their selective inhibitor drug, dichloroacetate (DCA) [33-35]. Although PDK1 is the only one able to bind to all PDH phosphorylation sites, PDK3 appears to be the most active isoform [33]. PDK2 is the most sensitive to inhibition by DCA and is ubiquitously expressed in different human tissues, while the others are more tissue specific [33,34]. PDK4 is essentially related to physiological metabolic flexibility and it is the only isoform not upregulated by HIF1-α [32,36]. PDK isoforms’ expression has been evaluated in various types of cancer, namely head and neck squamous cell carcinoma (HNSCC) [37], colon cancer [38], renal cell carcinoma [39] and gastric cancer [40].
DCA has been used in the treatment of conditions associated with lactic acidosis in the setting of mitochondrial dysfunction, such as congenital mitochondrial diseases [35]. In non-small-cell lung, glioblastoma and breast cancer cells, Bonnet et al. reported that DCA induces apoptosis and decreases cell growth, by promoting glucose oxidation, mitochondrial membrane depolarization and ROS production [41]. These effects have been replicated in different cancer models and seem to be selective in cancer cells [35,41,42]. Moreover, DCA is also able to suppress angiogenesis through indirect HIF1-α inhibition [43]. All these data combined with the well-known safety profile in humans prove that DCA is a promising drug for cancer therapy. A clinical trial to evaluate the effect of DCA in glioblastoma patients was already
Cutaneous melanoma (CM) is a very aggressive malignancy, and despite being the least common type of skin cancer, it is responsible for the majority of skin cancerrelated deaths. As the incidence of CM is rising, it is at present the most probable invasive cancer to develop before the age of 50 years in male gender [1,2]. Exposure to UV radiation is considered the main risk factor for melanomagenesis [2]. CM can be classified in different histological subtypes, being the most common superficial spreading melanoma (SSM), followed by nodular melanoma (NM), lentigo maligna melanoma (LMM) and acral lentiginous melanoma (ALM). SSM and NM arise in the skin with intermittent sun exposure, whereas LMM occurs in chronic sundamaged skin and ALM is restricted to skin with no sun exposure. This histological classification has no prognostic value [3,4]. Staging of CM takes into account tumor thickness, ulceration, mitotic rate, node involvement and the presence of metastasis [5]. Fortunately, most cases of CM are diagnosed in an early stage, with a 5-year survival rate reaching 98% [1]. Nevertheless, for patients with metastatic melanoma, the median survival is only 8 – 9 months [5]. CM is a very heterogeneous tumor and many cell-signaling pathways are deregulated in melanomagenesis [6,7]. The MAPK pathway is constitutively activated in the majority of CMs. NRAS mutations were reported in 10 – 20% of CMs, NRASQ61K/R being the most common. BRAF mutations, and in particular the BRAFV600E mutation, were identified in 40 – 60% of cases. Our group observed an association between the presence of BRAF mutations and the recently described TERT promoter mutations in CM [8]. BRAFV600E, and to a lesser extent, NRASQ61K/R mutations were also reported in almost 80% of nevi (benign melanocytic lesions that are considered as precursors of CM in 25% of the cases), indicating that the activation of the MAPK pathway may be necessary but not sufficient for melanoma development [7,9,10]. In fact, BRAFV600E has been related to oncogene-induced senescence and therefore may lead, in many nevi, to a growth-arrest condition [11]. Activation of the PI3K-AKTmTOR pathway may overcome this senescence phenotype and boost tumor progression [12]. Our group has confirmed the importance of the PI3K-AKT-mTOR pathway in CM aggressiveness by associating its activation with the presence of BRAF mutations and worse prognostic features. Indeed, overexpression of mTOR pathway effectors was associated with higher mitotic rate, higher Clark level, increased tumor thickness and the presence of skin ulceration [13].
Before 2011, treatment options for patients with advanced CM relied mainly on conventional chemotherapy, which had low response rates and minor effects in patients’ overall survival (OS). Ever since, five new drugs were approved for stage IV CM patients [14]. Ipilimumab, an anti-CTLA4 antibody, revealed marked improvements in OS of the patients, but its adverse effects turned it not suitable for all patients [15]. Vemurafenib and dabrafenib, selective inhibitors of BRAFV600E, and trametinib, a MEK inhibitor, all target the MAPK pathway and were reported to achieve response rates greater than 50%, even better than those for ipilimumab. However, their improvements in OS do not exceed 7 – 8 months due to the development of resistance [16-18]. Recently, another immune modulator, pembrolizumab, an antibody against the programmed death receptor-1 (PD-1), was approved for the treatment of patients with unresectable or metastatic melanoma and disease progression following ipilimumab or, if BRAFV600 mutation positive, a BRAF inhibitor [19]. Clinical trials with drugs targeting the PI3K-AKT-mTOR pathway are underway [4,14], yet new therapeutic approaches are warranted. Cancer cell metabolism differs from that of normal cells. In normal cells, depending on O2 availability, glucose can be partially metabolized to lactate through glycolysis in hypoxic conditions, or it can be fully oxidized to CO2 in the presence of O2, through mitochondrial oxidative phosphorylation, a more efficient energetic process. Cancer cells, on the other hand, metabolize most glucose to lactate, regardless of their O2 supply, the so-called Warburg effect [20,21]. The acquisition of this glycolytic phenotype in cancer cells is not fully understood, still an essential role has been recognized for the transcription factor hypoxia-inducible factor 1a (HIF1-α) [22]. HIF1-α protein is known to be stabilized under hypoxia, but oncogenic pathways, such as the MAPK and the mTOR pathways, also seem to mediate its activation in cancer (Figure 1) [22,23]. Strong evidence indicates that CM acquires this glycolytic phenotype, which can be confirmed by FDGPET scanning of patients [24-27]. In fact, HIF1-α appears to be overexpressed in CM, because the skin is a mild-hypoxic environment and the production of melanin indirectly stimulates HIF1-α expression by ROS production [28-30]. Yet, cytoplasmic glycolysis must be uncoupled from the mitochondrial oxidative phosphorylation, so that most pyruvate can be converted into lactate. This last process is driven by pyruvate dehydrogenase kinase (PDK), an enzyme upregulated by HIF1-α (Figure 1) [31,32]. PDK is an element of the mitochondrial pyruvate dehydrogenase complex (PDC). PDC comprises the pyruvate dehydrogenase (PDH) enzyme and its regulatory proteins: PDK that by phosphorylating PDH acts as an inhibitor, and pyruvate dehydrogenase phosphatase that activates PDH by dephosphorylation [33]. Dephosphorylated PDH catalyzes the oxidative decarboxylation of pyruvate into acetyl-CoA, CO2 and NADH (H+ ), thereby linking the glycolytic pathway to the oxidative pathway of tricarboxylic acid cycle (Figure 1) [33]. There are four isoforms of PDK (1, 2, 3, 4) which differ in their intrinsic activity, tissue distribution and sensitivity to their selective inhibitor drug, dichloroacetate (DCA) [33-35]. Although PDK1 is the only one able to bind to all PDH phosphorylation sites, PDK3 appears to be the most active isoform [33]. PDK2 is the most sensitive to inhibition by DCA and is ubiquitously expressed in different human tissues, while the others are more tissue specific [33,34]. PDK4 is essentially related to physiological metabolic flexibility and it is the only isoform not upregulated by HIF1-α [32,36]. PDK isoforms’ expression has been evaluated in various types of cancer, namely head and neck squamous cell carcinoma (HNSCC) [37], colon cancer [38], renal cell carcinoma [39] and gastric cancer [40]. DCA has been used in the treatment of conditions associated with lactic acidosis in the setting of mitochondrial dysfunction, such as congenital mitochondrial diseases [35]. In non-small-cell lung, glioblastoma and breast cancer cells, Bonnet et al. reported that DCA induces apoptosis and decreases cell growth, by promoting glucose oxidation, mitochondrial membrane depolarization and ROS production [41]. These effects have been replicated in different cancer models and seem to be selective in cancer cells [35,41,42]. Moreover, DCA is also able to suppress angiogenesis through indirect HIF1-α inhibition [43]. All these data combined with the well-known safety profile in humans prove that DCA is a promising drug for cancer therapy. A clinical trial to evaluate the effect of DCA in glioblastoma patients was already performed, reporting increased apoptosis and decreased angiogenesis, with promising results in four of five patients [44].
In the present study, PDK 1 – 3 isoforms’ expression in CM was assessed and its association with the expression of major signaling pathway cascades for melanomagenesis and with the prognosis of melanoma patients was evaluated. Also, in vitro studies were performed to assess the effect of DCA treatment in metabolism, proliferation and survival of melanoma cell lines with different genetic profiles.
Materials and methods
Sample selection, clinical-pathological and prognostic parameters
Formalin-fixed, paraffin-embedded tissues from 120 CM cases and from 22 melanocytic nevi (12 compound nevi and 10 Spitz nevi) were retrieved from the Service of Anatomic Pathology of the Hospital S. Joa˜o, Porto, and of Hospital S. Marcos, Braga. Clinical-pathological (Table 1) and follow-up data were obtained from the patients’ records and the Oncology Registries of Hospital S. Joa˜o and of Hospital S. Marcos, and from RORENO (Oncology Registry of North Region). All cases were revised and staged according to the 7th edition of AJCC [5]. Follow-up data include the recurrences and metastases (DFS; n = 108) and the number of deaths due to melanoma (disease-specific mortality; OS; n = 118). The mean follow-up time of the patients for DFS was 51 months (SE ± 3.59, range 1-195) and for OS was 55 months (SE ± 3.48, range 1 – 207). This work was approved by the Local Ethical Committee and was in accordance with the National Ethical rules.
Immunohistochemical analysis
Staining for the proteins analyzed was performed on 3-µm paraffin sections of representative tumor areas, mounted on poly-L-lysine-coated slides. Sections were deparaffinized and rehydrated, followed by a microwave antigen retrieval procedure with 10 mM sodium citrate buffer pH 6.0 with 1 mM EDTA pH 9.0 (PDK2), or EDTA buffer pH 9.0 (PDK1 and PDK3). The sections were incubated overnight at 4°C in a humidified chamber with the primary antibodies PDK1 (polyclonal, rabbit, 1:50), PDK2 (polyclonal, rabbit, 1:150), PDK3 (monoclonal, mouse, 1:500), all from Sigma-Aldrich Co. (St. Louis, Missouri, USA). The detection was obtained with the Envision G/2 System/AP (K5355; Dako, Denmark). alkaline phosphatase anti-alkaline phosphatase method (APAAP), and the color was developed with permanent red chromogen. The slides were counterstained with hematoxylin, and then mounted using a water-miscible mounting medium. The APAAP method was performed to avoid melanin pigmentation interference with immunohistochemistry analysis. Human stomach tissue was used as negative (omission of primary antibody) and positive control.
Immunohistochemical evaluation
Three observers (J.M.L., H.P. and R.C.) evaluated tumor cell immunoreactivity without the knowledge of any clinical data of the cases. Adjacent non-tumor tissue immunoreactivity was used as an internal control. An IHC score was settled for PDK1 – 3, and results from the multiplication of the intensity score of the staining (negative = 0, weak = 1, moderate = 2 and strong = 3) and the extension score of the immunoreactivity of tumor cells (0 – 5% = 0, 6 – 25% = 1, 26 – 50% = 2, 51 – 75% = 3, 76 – 100% = 4). IHC scores were then classified as negative/low (score value £ 4) and moderate/high (score value > 4). Analyses of the MAPK and the PI3KAKT-mTOR cascades in part of the series have been previously done [13] and the results were used in this study.
DNA extraction and mutation analysis
Extraction of DNA from tumors smaller than 5 mm was performed after microdissection with PALM MicroLaser Systems (PALM, Germany) and using the Quiamp DNA micro kit (Quiagen, Hilden). In tumors larger than 5 mm, DNA extraction was done by manual dissection of 10 µm whole sections of paraffin-embedded tissue using the Invisorb spin tissue mini kit (Invitek, Berlin). BRAF exon 15 and NRAS exon 2 fragments were amplified by polymerase chain reaction (PCR) using previously described primers [45]. Genomic DNA (25 – 100 ng) was amplified by PCR using the following cycling conditions: 35 s at 94°C, 40 s at 58°C for BRAF and 57°C for NRAS, and 45 s at 72°C for 40 cycles.
| Clinical-pathological features | |
| Number of cases (n) | 120 |
| Median age (± SD) | 61.5 ± 17.0 |
| Gender (n [%]) | |
| Female | 68 (56.7) |
| Male | 52 (43.3) |
| Sun exposure (n [%]) | |
| Absent | 27 (22.7) |
| Intermittent | 72 (60.5) |
| Chronic | 20 (16.8) |
| Histological subtype (n [%]) | |
| LMM | 16 (13.3 |
| ALM | 24 (20.0) |
| NM | 19 (15.8) |
| SSM | 61 (50.8) |
| Median thickness (mm) | 3.7 (0 — 70) |
| Epidermal ulceration (n [%]) | |
| Absent | 79 (65.8) |
| Present | 41 (34.2) |
| Mitotic rate (n [%]) | |
| < 1/mm2 | 45 (37.5) |
| ≥1/mm2 | 75 (62.5 |
| pT (n [%]) | |
| ≤ pT2 | 62 (51.7) |
| >pT2 | 58 (48.3) |
All PCR products were purified and directly sequenced on an ABI Prism 3130 xl Automatic sequencer (Perkin-Elmer, Foster City, CA) using the ABI Prism Dye Terminator Cycle sequencing Kit (Perkin-Elmer). The sequencing reaction was performed in the forward direction, and an independent PCR amplification, in the forward and reverse direction, was performed in samples suspected to carry mutations. Again, BRAF and NRAS mutational analysis in part of the series has been previously done [13] and the results were used in this study.
Cell lines and culture conditions
Two cell lines were used in this work, A375 skin melanoma cell line that harbors BRAFV600E and Mewo skin melanoma cell line that harbors BRAFwt. Both cell lines were tested for the presence of mycoplasma.
A375 was maintained in RPMI medium (Gibco/BRL – Invitrogen) and Mewo was maintained in DMEM medium (Gibco/BRL – Invitrogen). All media were supplemented with 10% fetal bovine serum, 100 U/ml Penicillin and 100 µg/ml Streptomycin. Cell lines were maintained in a humidified atmosphere (5% CO2) at 37°C.
Treatment of melanoma cell lines with DCA
Sodium DCA, purchased from Sigma-Aldrich (St. Louis, MO, EUA), was dissolved in dH2O and added to the culture medium and used for 24 and 48 h treatment. Melanoma cells incubated with culture medium supplemented with dH2O served as control.
Cell viability assay
The effects of DCA in melanoma cell lines growth was analyzed by PrestoBlue (PB) assay. Cells were seeded in 96-well plates at a density of 5 103 in 200 µl medium. After 24 h, the medium was replaced by a medium containing 5, 20, 40, 60 mM of DCA. Cells were incubated for 24 and 48 h, washed with PBS (pH 7.4) and assayed for cell growth using PB according to the manufacturer’s instructions. During incubation with the cells, PB reagent is modified by the reducing environment of the viable cells and becomes highly fluorescent. Fluorescence was measured using a microplate reader (Synergy HT Multi-Mode Microplate Reader, BioTek Instruments Inc., Winooski, VT, USA) at excitation and emission wavelengths of 560 and 590 nm, respectively. The absorbance of the wells containing culture medium and tumor cells was used as control and each experimental condition was evaluated with triplicates and repeated in duplicate. By comparing the measured fluorescence/absorbance of the wells containing DCA with the measurements of the wells containing untreated cells, it was possible to generate dose-response profiles and determine IC50 (the concentration that inhibits survival in 50%) values, using GraphPadPrism5.0 (GraphPad Software, Inc., La Jolla, CA).
Glucose and lactate quantification
For glucose and lactate level measurements, melanoma cells were plated in 6-well plates at a final density of 2 105 cells/well and incubated at 37°C for 24 h. Cells were then treated with 35 mM of DCA. As controls, cells were incubated with the vehicle compound (dH2O). Following 24 and 48 h of treatment, culture medium was collected. Glucose levels present in the conditioned medium in culture were quantified using Glucose GOD/PAP Kit (Roche Applied Sciences) and subtracted to the initial levels (0 h). Lactate was quantified in a similar manner, using the LO-POD enzymatic colorimetric assay (Spinreact, Sant Esteve de Bas, Spain).
Cell cycle and apoptosis analysis
For cell cycle profile and apoptosis analysis, melanoma cells were plated in 6-well plates at a final density of 1 105 cells/well and incubated at 37°C for 24 h. Cells were then treated with DCA at 35 mM for 24 and 48 h of treatment. As controls, cells were incubated with the vehicle compound (dH2O). For cell-cycle analysis, cells were then harvested and fixed overnight in ice-cold 70% ethanol. Afterward, cells were resuspended in PBS with 0.1 mg/ml RNase A and 5 µg/ml propidium iodide, before analysis. For apoptosis measurements, cells were harvested and the levels of apoptosis were analyzed by flow cytometry using the Annexin-V FITC Apoptosis Kit (Clontech Laboratories, Inc., Saint-Germainen-Laye, France) according to the manufacturer’s instructions. Flow cytometry analysis of cellular DNA content and phosphatidylserine externalization was performed with a flow cytometer (BD Accuri C6), plotting at least 20,000 events per sample. The data were analyzed using the FlowJo 7.6.5 software (Tree Star, Inc., Ashland, USA).
Western blot analysis and antibodies
Cells were lysed for 15 min at 4°C using RIPA buffer (1% NP-40 in 150 mM NaCl, 50 mM Tris (pH 7.5), 2 mM EDTA) containing phosphatase and protease inhibitors. Proteins were quantified using a modified Bradford assay (Biorad). Protein samples (50 µg) were separated in 10% SDS/ PAGE gels and electroblotted to Hybond ECL membrane (Amersham Biosciences). We used the following primary antibodies: PDH and pPDH Ser293, from Abcam; PDK1 (Sigma-Aldrich), PDK2 (Sigma-Aldrich), HIF1-α (Transduction Laboratories) and the mTOR pathway effectors pS6 Ser235/236, s6, p-4EBP1 Thr37/46, 4EBP1, all from Cell Signaling Technology. Secondary antibodies were conjugated with peroxidase (Santa Cruz Biotechnology) and visualized by the ECL detection solution. Membranes were re-stained with a goat polyclonal anti-actin (Santa Cruz Biotechnology) antibody for protein loading control. All experiments and quantifications (using Bio-Rad Quantity One 1-D Analysis software (4.6.6 version)) were performed in triplicate.
Statistical analysis
Statistical analysis was performed using STAT VIEW-J 5.0 (SAS Institute, Inc., Cary, NC). The relationship between the average expression level (score) of the immunohistochemistry markers and clinical-pathological parameters was evaluated by ANOVA. When appropriate, multiple comparison corrections were performed using the post hoc Bonferroni and Tamhane tests. The correlation between the immunoreactivity score of the different markers was assessed using Fisher’s exact test. The data from the cell lines experiments were analyzed by the two-tailed unpaired Student’s t-test. The Kaplan-Meier method and log-rank test were used to evaluate the melanoma survival data. Univariate and multivariate analyses were performed to determine the prognostic value of covariates regarding OS and DFS using the Cox regression model. OS and DFS were calculated from the time of diagnosis until death due to disease or metastasis, respectively, or censored at the time of the latest follow-up or death unrelated to the disease. A p value < 0.05 was considered statistically significant.
Results
Expression of PDKs in CM and nevi
Both in CM and nevi lesions, PDK 1, 2 and 3 isoforms were expressed not only in melanocytes/melanoma cells, but also in keratinocytes and in the cells of sebaceous glands and hair follicles. The expression levels of all PDK isoforms analyzed were positively correlated between them, suggesting a concomitant expression of these proteins (Table 2).
| Protein | Mean expression level (± SD) | Correlation (p value) | Correlation (p value) | Correlation (p value) |
| PDK1 | 4.8 ± 3.5 | < 0.01* | < 0.01§ | |
| PDK2 | 4.6 ± 3.6 | < 0.01† | ||
| PDK3 | 7.0 ± 3.2 |
*Between PDK1 and PDK2; † between PDK2 and PDK3; § between PDK1 and PDK3.
PDK1 immunohistochemical expression
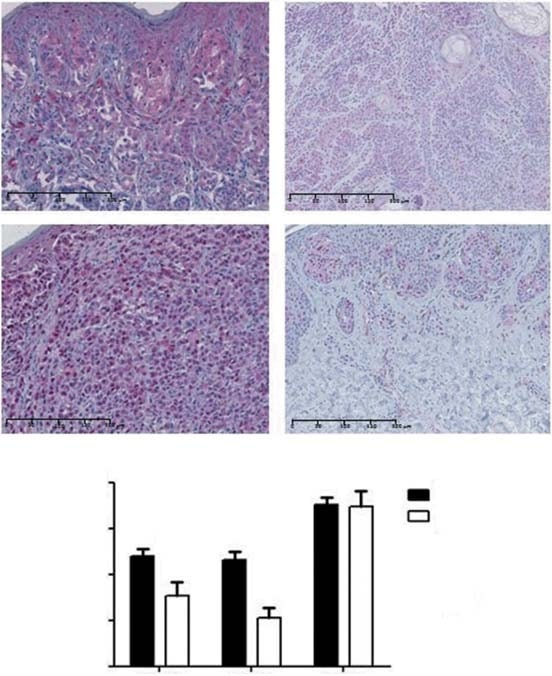
Cytoplasmic PDK1 staining was observed in 88% of CM and 76% of nevi (Figure 2A). Negative/low staining score was observed in 52 and 76% and moderate/high staining score was observed in 48 and 24% of melanomas and nevi, respectively. Therefore, CM displayed significantly higher mean levels of PDK1 expression than nevi (p = 0.03; Figure 2B). Regarding the histological subtypes of CM, LMM displayed greater PDK1 expression levels than NM (p = 0.04) and ALM (p = 0.04). No association was found between the expression of PDK1 and type of sun exposure. With regard to the prognostic factors, PDK1 was more expressed in tumors £ 1 mm thick (p = 0.02). Higher PDK1 expression levels were associated with lower tumor stages (p = 0.04), but not with overall and disease-free survival of the patients. We also evaluated if the expression of PDK isoforms was related to the MAPK and the PI3K-AKT-mTOR pathways. No association was found between the expression of PDK1 and BRAF/NRAS mutations or with the activation of the MAPK pathway (evaluated by pERK expression). PDK1 expression was positively correlated with the expression of proteins of the PI3K-AKT-mTOR cascade, namely mTOR and 4EBP1 (p = 0.02 and p = 0.04, respectively).
PDK2 immunohistochemical expression
PDK2 displayed both nuclear and cytoplasmic expression in 87% of CM and 83% of nevi (Figure 2A). Negative/low staining score was observed in 58 and 89% and moderate/high staining score was observed in 42 and 11% of melanomas and nevi, respectively. The mean expression level of PDK2 was higher in CM compared to nevi (p < 0.01; Figure 2B). With regard to the histological subtypes of CM, SSM exhibited higher levels of PDK2 expression than ALM (p = 0.02). We did not find any association between type of sun exposure and the expression of PDK2. Lower tumor stages showed significantly higher levels of PDK2 (p = 0.02), although no association was found between the expression of this isoform and the main prognostic factors of CM, neither with overall and disease-free survival of the patients. PDK2 expression was not associated with BRAF/NRAS mutational status or with the activation of the MAPK pathway. A significant positive correlation was found between PDK2 expression and AKT expression from the PI3K-AKT-mTOR cascade (p = 0.03).
PDK3 immunohistochemical expression
PDK3 displayed cytoplasmic expression in all CM and nevi. Negative/low staining score was observed in 28 and 22% and moderate/high staining score was observed in 72 and 78% of CM and nevi, respectively. The level of expression of PDK3 isoform was similar between CM and nevi (Figure 2B). There were no significant differences when comparing the mean level of PDK3 expression between CM subtypes and the type of sun exposure. Tumors with thickness £ 1 mm and those with lower stages displayed higher levels of PDK3 (p = 0.01 and p < 0.01, respectively). Ulceration, mitotic rate and overall and disease-free survival of the patients were not significantly associated with PDK3 expression. No association was found between the expression of PDK3 and BRAF/NRAS mutations nor the activation of the MAPK cascade. Regarding the PI3K-AKT-mTOR pathway, PDK3 expression was positively correlated with total AKT, mTOR and 4EBP1 expression (p < 0.01, p < 0.01 and p = 0.04, respectively). Due to the general expression of PDK3 in every CM and nevi, the subsequent in vitro analysis did not include this PDK isoform.
The effect of DCA treatment in melanoma cell lines viability
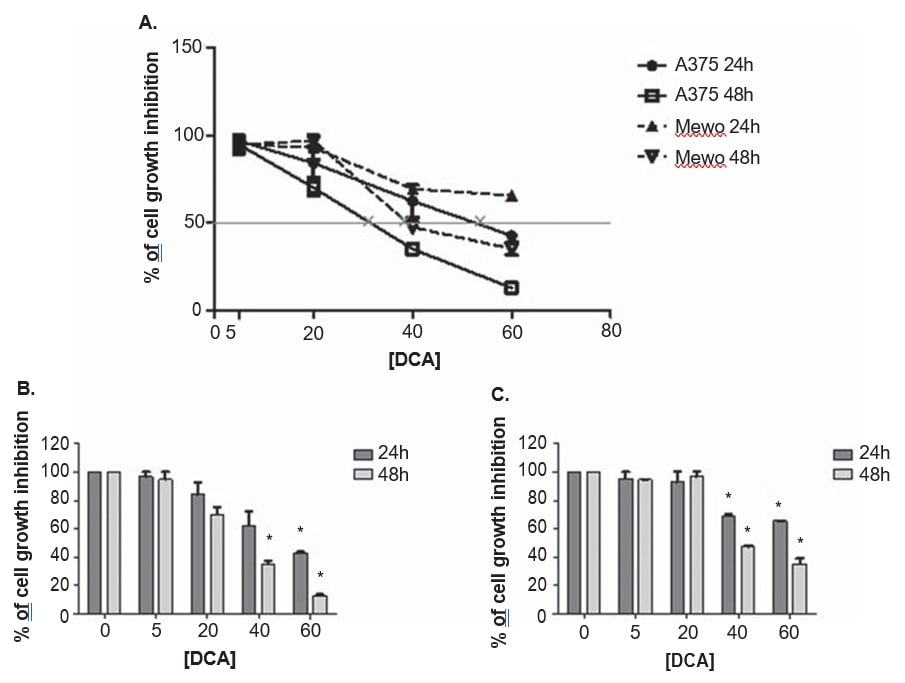
A375 and Mewo melanoma cell lines were exposed to increasing concentrations of DCA to establish the effect on cell viability, using the PrestoBlue assay. DCA reduced the viability of both cell lines in a dose-dependent manner after 24 and 48 h treatment, although A375 was slightly more sensitive to DCA treatment, with a higher growth inhibition when compared to Mewo cell line (Figure 3). The effect of DCA on A375 cell viability was observed after treatment with 5 mM and in Mewo cell line was more intense after 20 mM treatment, with inhibition values ranging between 3 and 87% in A375 and 5 to 65% in Mewo. The IC50 values were estimated as 33 ± 5.5 mM for A375 and 39.9 ± 2.2 mM for Mewo cell line, after 48 h of DCA treatment (Figure 3).
The effect of DCA treatment in glucose consumption and lactate production levels of melanoma cell lines
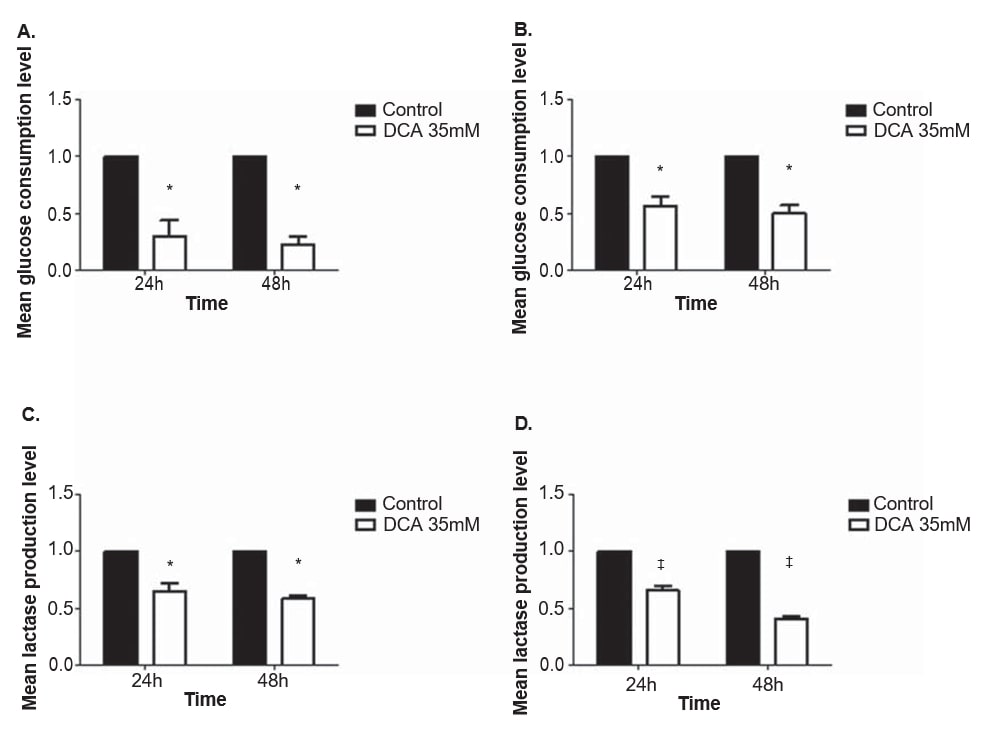
To evaluate the effect of DCA in the metabolism of melanoma cell lines, glucose and lactate levels were quantified in the culture medium after 24 and 48 h treatment with 35 mM of DCA, a concentration near the IC50 for both cell lines. The consumption of glucose and the production of lactate decreased in both melanoma cell lines after treatment with DCA (Figure 4). A375 and Mewo cell lines displayed a significant decrease in the glucose consumption level both after 24 and 48 h of DCA treatment (p = 0.01 and p < 0.01, respectively). The lactate production level was also significantly decreased after 24 and 48 h in A375 (p = 0.01 and p < 0.01, respectively) and in Mewo (p < 0.01) cell lines.
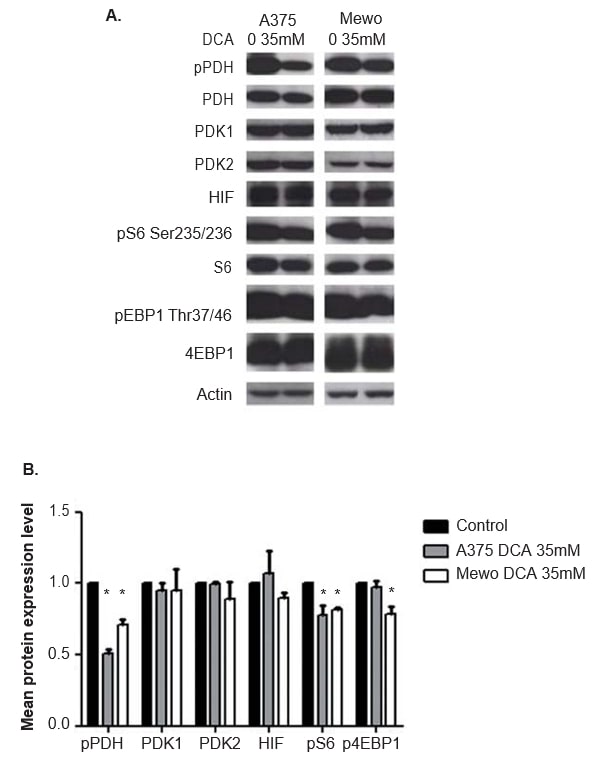
The effect of DCA treatment in PDK and mTOR pathway effectors, and in HIF1-α expression in melanoma cell lines
The efficacy of DCA treatment in inhibiting the PDK activity was evaluated by analyzing the expression of the phosphorylated downstream effector PDH, by western blot. At 24 h after DCA treatment, significantly inhibition of the phosphorylation of PDH in both cell lines was observed (p < 0.01; Figure 5). PDK1 and PDK2 expression was not altered by DCA treatment (Figure 5), as expected. The expression of the two downstream effectors and readouts of mTOR pathway activation, S6 and 4EBP1, was also evaluated. Although DCA treatment did not alter S6 and 4EBP1 expression, the expression level of the phosphorylated forms of both proteins was decreased in A375 (p = 0.03 and not significant, respectively) and in Mewo (p < 0.01 and p = 0.01, respectively; Figure 5). As DCA may affect HIF1-α levels, the expression of this protein was also evaluated, and no change was observed after DCA treatment (Figure 5). Similar results were obtained at 48 h after DCA treatment, which significantly inhibits phosphorylation of PDH in both cell lines (p <0.01). The expression level of the phosphorylated forms of S6 and 4EBP1 was significantly decreased in A375 (p = 0.01 and p = 0.02, respectively) and in Mewo (p = 0.01 and not significant, respectively). The expression of PDK1, PDK2 and HIF1-α was not altered (data not shown).
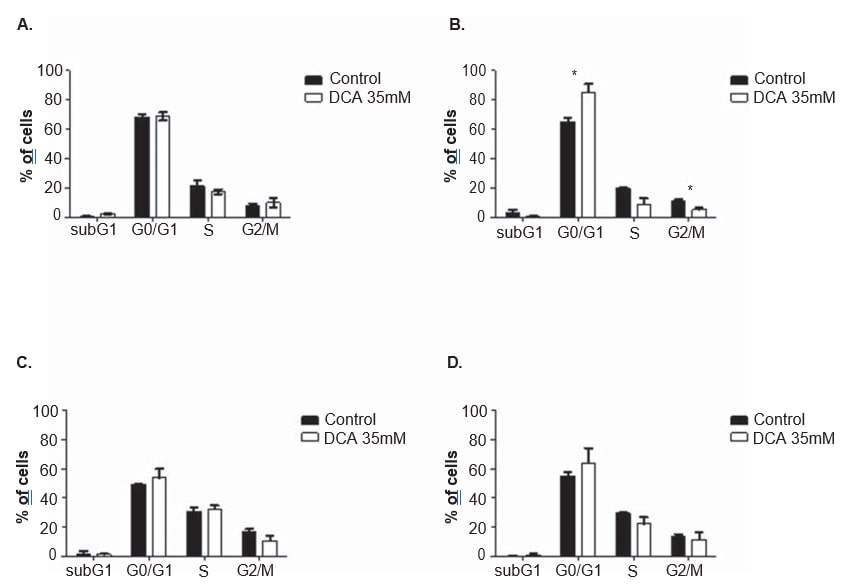
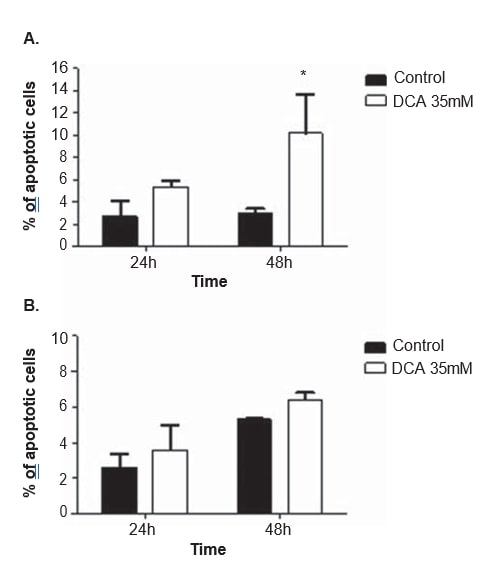
The effect of DCA treatment in cell cycle and apoptosis of melanoma cell lines
To clarify the mechanism of action of DCA, cell cycle analysis and apoptosis measurements were performed in both cell lines, after 24 and 48 h of treatment with 35 mM of DCA. The cell cycle was analyzed with propidium iodide. After 48 h of DCA treatment, A375 cell line displayed a significant increase in the percentage of cells in the G0/G1 phase of the cell cycle (from 65.0 ± 4.9% observed in non-treated cells to 85.2 ± 10.2% in DCA-treated cells; p = 0.04), a significant decrease in G2/M (from 11.3 ± 1.3% observed in non-treated cells to 5.2 ± 2.2% in DCA-treated cells; p = 0.01) and a decrease, not reaching the threshold of statistical significance, in S phase (from 19.7 ± 1.8% observed in non-treated cells to 9.1 ± 6.7% in DCA-treated cells; p = 0.06; Figure 6). The same tendency was observed in Mewo cell line 48 h after DCA treatment (increase in the percentage of cells in G0/G1, and decrease in S and G2/M) although not reaching statistical significance (Figure 6). Flow cytometry analysis was carried out following Annexin V/Propidium iodide staining. A significant increase in the number of apoptotic cells in A375 cell line after 48 h of DCA treatment was observed (3.0 ± 0.5% in non-treated cells to 16.9 ± 4.6% in DCAtreated cells; p < 0.01; Figure 7). Non-significant increases in the percentage of apoptotic cells in A375 cell line after 24 h and in Mewo cell line after 24 h and 48 h treatment with DCA were observed.
Discussion
In this work, we established, for the first time, that CM overexpresses PDK1 and PDK2 proteins. PDKs are key proteins, regulated by HIF1-α, driving malignant cells into the aerobic glycolysis phenotype, a hallmark of cancer [20,22,31].
The Warburg effect is considered a resistance factor to conventional chemotherapies [21]. The overexpression of PDK found in CM leads us to evaluate the effect of DCA treatment in melanoma cell lines. We observed that DCA treatment decreases glucose consumption and lactate production in melanoma cell lines, consistent with the effect of DCA in the shifting from aerobic glycolysis to oxidative phosphorylation previously reported in cancer cells [41]. This shift in the glucose metabolism probably results from the observed significant decrease in the expression of the phosphorylated form of PDH, which also confirms the efficacy of DCA treatment. It is relevant to refer that the correct readout of DCA effect is the level of phosphorylated PDH, since by inhibiting PDK activity and not its expression, DCA stimulates PDH dephosphorylation (Figure 1).
We observed a dose-dependent decrease in cell viability after DCA treatment in both melanoma cell lines. Also, a downregulation of proliferation, through G0/G1 arrest, along with an increase in apoptosis was observed in both cell lines, but only statistically significant in A375 cell line. The fact that the concentration of DCA selected in the present study (35 mM) is slight below the IC50 for Mewo cell line may explain the less pronounced effect observed in those cells.
The relationship between DCA and HIF-1a in cancer is not completely understood, as DCA increases tissue oxygen consumption and ROS production, which should lead to HIF-1a up-regulation or stabilization, respectively [46,47]. Conversely, some authors reported that DCA leads to a decrease in HIF1-α expression [25,48,49]. In our work, no alteration was observed in HIF1-α level after DCA treatment of melanoma cell lines, concordant with Shahrzad et al. who reported that HIF1-α expression only decreases after DCA treatment in hypoxic conditions [49].
To overcome the mutant BRAF-induced senescence and to progress to more aggressive phenotypes, CM probably activates other signaling cascades, such as the mTOR pathway [12]. This pathway contributes to the Warburg effect by promoting HIF1-α activity, which in turn can increase PDK expression [23,31]. We have previously reported a complete activation of this pathway in CM [13]. In this study, we observed a concomitant expression of PDK 1, 2 and 3 and of the mTOR pathway effectors in CMs. The expression of the PDK isoforms in CM correlated positively with the expression of mTOR, as well as with upstream and downstream effectors of this pathway: AKT and 4EBP1. Moreover, we observed a significant decrease in pS6 and p4EBP1 in A375 and Mewo cell lines after DCA treatment.
Nevi share some genetic alterations with CM, as both present a high frequency of BRAF mutations [10]. Although in a much lower level, PDK’s expression was also observed in nevi. We evaluated whether the BRAF mutational status and the downstream activation of ERK could be associated with a higher expression of PDK. We did not find any association in nevi nor in CM. A375 cell line harbors the BRAFV600E mutation and Mewo cell line is wild type for this gene, and the response of both cells lines to DCA treatment was similar, despite having variable intensity. In fact, it was already reported that the BRAF mutational status does not alter the sensibility to DCA treatment [50]. These results contrast with our previous findings using mTOR pathway inhibitors in several melanoma-derived cell lines, where we found higher sensitivity to RAD001 treatment in the CM cell lines harboring BRAFV600E mutation [51].
PDK isoforms were expressed in the cytoplasm of the melanoma cells, thus supporting the well-known mitochondrial function of such isoforms [33]. Regarding PDK2, a nuclear expression was observed in the majority of the CM cases. This nuclear location has also been reported for PDK1 in HNSCC [37]. As far as we know, the role of PDK in the nucleus remains to be clarified but, recently, a nuclear function was advanced for PDH, the PDK downstream effector. Sutendra et al. reported that PDH is involved in the nuclear formation of acetyl-CoA [52]. In response to growth factor stimulation, PDH and its phosphatase translocate from the mitochondria, where it is inhibited by PDK, to the nucleus, but a nuclear location for PDK was not identified [52]. Yet, there is evidence that some glycolytic enzymes are engaged in other cellular functions besides the glycolysis, namely in transcriptional regulation [53]. Additional studies are necessary to clarify whether PDK also plays a nuclear function.
In renal cell carcinoma, PDK1 expression was reported to decrease along tumor progression [39]. Concordantly, in our work, PDK was found to be more expressed in lower tumor stages, without influencing the overall and the disease-free survival of the melanoma patients. At variance, PDK overexpression was identified as a marker of tumor progression, poor prognosis and recurrence, in HNSCC and gastric cancer [37,40,54]. Although our aim was not to explore the prognostic role of PDK in CM, our results suggest that PDKs in CM may play a more active role in melanoma development than in melanoma progression. We are aware that our series is mainly composed of primary CM and that further studies in advanced (metastatic) melanoma will be necessary in order to clarify this issue.
Our aim in this study was to explore biomarkers for new therapeutic approaches in CM patients. Our results suggest a potential usefulness of DCA in the management of CM patients, in line with Abildgaard et al. who reported a decrease in ATP levels and melanoma growth using DCA treatment [50]. These authors also reported a synergistic combination between DCA and a BRAF inhibitor, vemurafenib [50]. Furthermore, our results show a concomitant expression of PDK and mTOR pathway effectors in CM and downregulation of mTOR pathway activity by DCA treatment. Considering the results of Hong et al. who reported a synergistic effect of the combination of DCA with a S6K1 (mTOR pathway effector) inhibitor [55], it is tempting to speculate that a synergistic therapeutic effect may be achieved in CM using the combination of DCA with a direct mTOR inhibitor.
Conclusion
We report for the first time the overexpression of PDK1 and 2 in CM in comparison to nevi. The expression of PDKs was found to be associated with the expression of mTOR pathway effectors and not related with the BRAF mutational status. DCA treatment leads to a shift in metabolism, downregulation of proliferation, increased apoptosis and decreased mTOR pathway activation in melanoma cell lines. Taking all these results together, we conclude that PDK expression may play a role in melanoma development and that its inhibition by DCA alone or in combination with direct mTOR inhibitors may benefit CM patients.
Acknowledgments
We are grateful to all of the patients who participated in this study as well as the physicians who provided clinical, pathological and follow-up information. We thank Dr Madalena Pinto, from CEQUIMED, Faculty of Pharmacy, University of Porto, Portugal, who kindly provided us A375 skin melanoma cell line, and Dr Marc Mareel, from the Department of Radiotherapy and Nuclear Medicine, Ghent University Hospital, Belgium, who kindly provided us Mewo skin melanoma cell line. We thank Gabriela Almeida for the helpful technical advices regarding the PB assay. We also thank Prof Manuel Sobrinho Simões for the critical reading of this manuscript. H Pópulo and R Caldas contributed equally to this work.
Declaration of interest
This study was supported by the Portuguese Foundation for Science and Technology through Post-Doc grant to HP (Ref.: SFRH/BPD/85249/2012). Further funding was obtained from the project “Microenvironment, metabolism and cancer” that was partially supported by Programa Operacional Regional do Norte (ON.2 – O Novo Norte) under the Quadro de Referência Estratégico Nacional (QREN) and the Fundo Europeu de Desenvolvimento Regional (FEDER). IPATIMUP integrates the i3S Research Unit, which is partially supported by FCT, the Portuguese Foundation for Science and Technology. This work was funded by FEDER funds through the Operational Programme for Competitiveness Factors – COMPETE and National Funds through the FCT, under the projects “PEst-C/SAU/LA0003/2013.” The authors disclose no potential conflicts of interest. The authors have no other relevant affiliations or financial involvement with any organization or entity with a financial interest in or financial conflict with the subject matter or materials discussed in the manuscript apart from those disclosed.
REFERENCES
1 Siegel R, Ma J, Zou Z, et al. Cancer statistics, 2014. CA Cancer J Clin 2014;64(1):9-29
2 Nikolaou V, Stratigos AJ. Emerging trends in the epidemiology of melanoma. Br J Dermatol 2014;170(1):11-19
3 Smoller BR. Histologic criteria for diagnosing primary cutaneous malignant melanoma. Mod Pathol 2006;19(Suppl 2):S34-40
4 Populo H, Soares P, Lopes JM. Insights into melanoma: targeting the mTOR pathway for therapeutics. Expert Opin Ther Targets 2012;16(7):689-705
5 Balch CM, Gershenwald JE, Soong SJ, et al. Final version of 2009 AJCC melanoma staging and classification. J Clin Oncol 2009;27(36):6199-206
6 Lopez-Bergami P, Fitchman B, Ronai Z. Understanding signaling cascades in melanoma. Photochem Photobiol 2008;84(2):289-306
7 Bertolotto C. Melanoma: from melanocyte to genetic alterations and clinical options. Scientifica 2013;2013:22
8 Populo H, Boaventura P, Vinagre J, et al. TERT promoter mutations in skin cancer: the effects of sun exposure and X-irradiation. J Invest Dermatol 2014;134(8):2251-7
9 Elder DE. Precursors to melanoma and their mimics: nevi of special sites. Modern pathology Inc 2006;19(Suppl 2):S4-20
10 Kumar R, Angelini S, Snellman E, et al. BRAF mutations are common somatic events
11 in melanocytic nevi. J Invest Dermatol 2004;122(2):342-8 Michaloglou C, Vredeveld LC, Soengas MS, et al. BRAFE600-associated senescence-like cell cycle arrest of human naevi. Nature 2005;436(7051):720-4
12 Vredeveld LC, Possik PA, Smit MA, et al. Abrogation of BRAFV600E-induced senescence by PI3K pathway activation contributes to melanomagenesis. Genes Dev 2012;26(10):1055-69
13 Populo H, Soares P, Faustino A, et al. mTOR pathway activation in cutaneous melanoma is associated with poorer prognosis characteristics. Pigment Cell Melanoma Res 2011;24(1):254-7
14 Olszanski AJ. Current and future roles of targeted therapy and immunotherapy in advanced melanoma. J manag Care Spec Pharm 2014;20(4):346-56
15 Hodi FS, O’Day SJ, McDermott DF, et al. Improved survival with ipilimumab in patients with metastatic melanoma. N Engl J Med 2010;363(8):711-23
16 Chapman PB, Hauschild A, Robert C, et al. Improved survival with vemurafenib in melanoma with BRAF V600E mutation. N Engl J Med 2011;364(26):2507-16
17 Flaherty KT, Robert C, Hersey P, et al. Improved survival with MEK inhibition in BRAF-mutated melanoma. N Engl J Med 2012;367(2):107-14
18 Ballantyne AD, Garnock-Jones KP. Dabrafenib: first global approval. Drugs 2013;73(12):1367-76
19Availablefrom:http://www.fda.gov/Drugs/InformationOnDrugs/ApprovedDrugs/ucm412861.htm
20 Gillies RJ, Robey I, Gatenby RA. Causes and consequences of increased glucose metabolism of cancers. J Nucl Med 2008;49(Suppl 2):24S-42S
21 Zhao Y, Butler EB, Tan M. Targeting cellular metabolism to improve cancer therapeutics. Cell Death Dis 2013;4:e532
22 Semenza GL. HIF-1 mediates metabolic responses to intratumoral hypoxia and oncogenic mutations. J Clin Invest 2013;123(9):3664-71
23 Wouters BG, Koritzinsky M. Hypoxia signalling through mTOR and the unfolded protein response in cancer. Nat Rev Cancer 2008;8(11):851-64
24 Scott DA, Richardson AD, Filipp FV, et al. Comparative metabolic flux profiling of melanoma cell lines: beyond the Warburg effect. J Biol Chem 2011;286(49):42626-34
25 Kluza J, Corazao-Rozas P, Touil Y, et al. Inactivation of the HIF-1alpha/PDK3 signaling axis drives melanoma toward mitochondrial oxidative metabolism and potentiates the therapeutic activity of pro-oxidants. Cancer Res 2012;72(19):5035-47
26 Baudy AR, Dogan T, Flores-Mercado JE, et al. FDG-PET is a good biomarker of both early response and acquired resistance in BRAFV600 mutant melanomas treated with vemurafenib and the MEK inhibitor GDC-0973. EJNMMI research 2012;2(1):22
27 Hall A, Meyle KD, Lange MK, et al. Dysfunctional oxidative phosphorylation makes malignant melanoma cells addicted to glycolysis driven by the (V600E)BRAF oncogene. Oncotarget 2013;4(4):584-99
28 Kumar SM, Yu H, Edwards R, et al. Mutant V600E BRAF increases hypoxia inducible factor-1alpha expression in melanoma. Cancer Res 2007;67(7):3177-84
29 Kuphal S, Winklmeier A, Warnecke C, et al. Constitutive HIF-1 activity in malignant melanoma. Eur J Cancer 2010;46(6):1159-69
30 Slominski A, Kim TK, Brozyna AA, et al. The role of melanogenesis in regulation of melanoma behavior: Melanogenesis leads to stimulation of HIF-1alpha expression and HIF-dependent attendant pathways. Archives of biochemistry and biophysics 2014;563:79-93
31 Kim JW, Tchernyshyov I, Semenza GL, et al. HIF-1-mediated expression of pyruvate dehydrogenase kinase: a metabolic switch required for cellular adaptation to hypoxia. Cell Metab 2006;3(3):177-85
32 Lu CW, Lin SC, Chen KF, et al. Induction of pyruvate dehydrogenase kinase-3 by hypoxia-inducible factor-1 promotes metabolic switch and drug resistance. J Biol Chem 2008;283(42):28106-14
33 Patel MS, Korotchkina LG. Regulation of the pyruvate dehydrogenase complex. Biochem Soc Trans 2006;34(Pt 2):217-22
34 Bowker-Kinley MM, Davis WI, Wu P, et al. Evidence for existence of tissue-specific regulation of the mammalian pyruvate dehydrogenase complex. Biochem J 1998;329(Pt 1):191-6
35 Papandreou I, Goliasova T, Denko NC. Anticancer drugs that target metabolism: Is dichloroacetate the new paradigm? Int J Cancer 2011;128(5):1001-8
36 Zhang S, Hulver MW, McMillan RP, et al. The pivotal role of pyruvate dehydrogenase kinases in metabolic flexibility. Nutrition & metabolism 2014;11(1):10
37 Wigfield SM, Winter SC, Giatromanolaki A, et al. PDK-1 regulates lactate production in hypoxia and is associated with poor prognosis in head and neck squamous cancer. Br J Cancer 2008;98(12):1975-84
38 Lu CW, Lin SC, Chien CW, et al. Overexpression of pyruvate dehydrogenase kinase 3 increases drug resistance and early recurrence in colon cancer. Am J Pathol 2011;179(3):1405-14
39 Baumunk D, Reichelt U, Hildebrandt J, et al. Expression parameters of the metabolic pathway genes pyruvate dehydrogenase kinase-1 (PDK-1) and DJ-1/PARK7 in renal cell carcinoma (RCC). World J Urol 2013;31(5):1191-6
40 Hur H, Xuan Y, Kim YB, et al. Expression of pyruvate dehydrogenase kinase-1 in gastric cancer as a potential therapeutic target. Int J Oncol 2013;42(1):44-54
41 Bonnet S, Archer SL, Allalunis-Turner J, et al. A mitochondria-K+ channel axis is suppressed in cancer and its normalization promotes apoptosis and inhibits cancer growth. Cancer Cell 2007;11(1):37-51
42 Kankotia S, Stacpoole PW. Dichloroacetate and cancer: New home for an orphan drug? Biochimica et biophysica acta 2014;1846(2):617-29
43 Sutendra G, Dromparis P, Kinnaird A, et al. Mitochondrial activation by inhibition of PDKII suppresses HIF1a signaling and angiogenesis in cancer. Oncogene 2013;32(13):1638-50
44 Michelakis ED, Sutendra G, Dromparis P, et al. Metabolic modulation of glioblastoma with dichloroacetate. Sci Transl Med 2010;2(31):31ra34
45 Castro P, Rebocho AP, Soares RJ, et al. PAX8-PPARgamma rearrangement is frequently detected in the follicular variant of papillary thyroid carcinoma. J Clin Endocrinol Metab 2006;91(1):213-20
46 Sun W, Zhou S, Chang SS, et al. Mitochondrial mutations contribute to HIF1alpha accumulation via increased reactive oxygen species and up-regulated pyruvate dehydrogenase kinase 2 in head and neck squamous cell carcinoma. Clin Cancer Res 2009;15(2):476-84
47 Cairns RA, Bennewith KL, Graves EE, et al. Pharmacologically increased tumor hypoxia can be measured by 18F-Fluoroazomycin arabinoside positron emission tomography and enhances tumor response to hypoxic cytotoxin PR-104. Clin Cancer Res 2009;15(23):7170-4
48 Sun RC, Board PG, Blackburn AC. Targeting metabolism with arsenic trioxide and dichloroacetate in breast cancer cells. Mol Cancer 2011;10:142
49 Shahrzad S, Lacombe K, Adamcic U, et al. Sodium dichloroacetate (DCA) reduces apoptosis in colorectal tumor hypoxia. Cancer Lett 2010;297(1):75-83
50 Abildgaard C, Dahl C, Basse AL, et al. Bioenergetic modulation with dichloroacetate reduces the growth of melanoma cells and potentiates their response to BRAFV600E inhibition. J Transl Med 2014;12:247
51 Populo H, Tavares S, Faustino A, et al. GNAQ and BRAF mutations show differential activation of the mTOR pathway in human transformed cells. Peer J 2013;1:e104
52 Sutendra G, Kinnaird A, Dromparis P, et al. A nuclear pyruvate dehydrogenase complex is important for the generation of acetyl-CoA and histone acetylation. Cell 2014;158(1):84-97
53 Kim JW, Dang CV. Multifaceted roles of glycolytic enzymes. Trends Biochem Sci 2005;30(3):142-50
54 Xuan Y, Hur H, Ham IH, et al. Dichloroacetate attenuates hypoxia-induced resistance to 5-fluorouracil in gastric cancer through the regulation of glucose metabolism. Exp Cell Res 2014;321(2):219-30
55 Hong SE, Shin KS, Lee YH, et al. Inhibition of S6K1 enhances dichloroacetate-induced cell death. J Cancer Res Clin Oncol 2014.