E. D. Michelakis,1 * G. Sutendra,1 P. Dromparis,1 L. Webster,1 A. Haromy,1 E. Niven,2 C. Maguire,2 T.-L. Gammer,1 J. R. Mackey,3 D. Fulton,3 B. Abdulkarim,3 M. S. McMurtry,1 K. C. Petruk4
1Department of Medicine, University of Alberta, Edmonton, Alberta, Canada T6G 2B7.
2Department of Biomedical Engineering and Diagnostic Imaging, University of Alberta, Edmonton, Alberta, Canada T6G 2B7.
3Department of Oncology, University of Alberta, Edmonton, Alberta, Canada T6G 2B7.
4Department of Neurosurgery, University of Alberta, Edmonton, Alberta, Canada T6G 2B7.
*To whom correspondence should be addressed. E-mail: [email protected]
Volume 2 Issue 31 31ra34
Submitted: 11 November 2009
Accepted: 23 April 2010
Published: 12 May 2010
Solid tumors, including the aggressive primary brain cancer glioblastoma multiforme, develop resistance to cell death, in part as a result of a switch from mitochondrial oxidative phosphorylation to cytoplasmic glycolysis. This metabolic remodeling is accompanied by mitochondrial hyperpolarization. We tested whether the small-molecule and orphan drug dichloroacetate (DCA) can reverse this cancer-specific metabolic and mitochondrial remodeling in glioblastoma. Freshly isolated glioblastomas from 49 patients showed mitochondrial hyperpolarization, which was rapidly reversed by DCA. In a separate experiment with five patients who had glioblastoma, we prospectively secured baseline and serial tumor tissue, developed patient-specific cell lines of glioblastoma and putative glioblastoma stem cells (CD133+ , nestin+ cells), and treated each patient with oral DCA for up to 15 months. DCA depolarized mitochondria, increased mitochondrial reactive oxygen species, and induced apoptosis in GBM cells, as well as in putative GBM stem cells, both in vitro and in vivo. DCA therapy also inhibited the hypoxia-inducible factor–1α, promoted p53 activation, and suppressed angiogenesis both in vivo and in vitro. The dose-limiting toxicity was a dose-dependent, reversible peripheral neuropathy, and there was no hematologic, hepatic, renal, or cardiac toxicity. Indications of clinical efficacy were present at a dose that did not cause peripheral neuropathy and at serum concentrations of DCA sufficient to inhibit the target enzyme of DCA, pyruvate dehydrogenase kinase II, which was highly expressed in all glioblastomas. Metabolic modulation may be a viable therapeutic approach in the treatment of glioblastoma.
INTRODUCTION
Glioblastoma multiforme (GBM) is an aggressive primary brain tumor that exhibits extremely poor responses to approved therapies (1). Chemotherapy with temozolomide (TMZ) plus radiation therapy (RT), administered after debulking surgery, increases median survival from 12.1 months with RT alone to 14.6 months (1). The median time to progression of the tumor after RT and TMZ is only 6.9 months (1). In recurrent gliomas, the progression-free survival and the response to TMZ are much worse (2). GBMs are very vascular tumors with remarkable molecular and genetic heterogeneity (1). An ideal therapy should increase GBM apoptosis, overcome the molecular heterogeneity, inhibit angiogenesis, and cross the blood-brain barrier while having minimal systemic toxicity. On the basis of our recent findings in animal models (3, 4), we hypothesized that the orphan small-molecule dichloroacetate (DCA) fulfills these criteria and may be effective in the treatment of GBM in humans.
DCA inhibits the mitochondrial enzyme pyruvate dehydrogenase kinase (PDK) (5). By inhibiting PDK, DCA activates pyruvate dehydrogenase (PDH), a gatekeeper enzyme that regulates the flux of carbohydrates (pyruvate) into the mitochondria, increasing the ratio of glucose oxidation to glycolysis (3–5). If pyruvate remains in the cytoplasm, it may complete glycolysis, producing lactic acid and generating 2 moles of ATP per glucose molecule. Alternatively, pyruvate can enter several anaplerotic and amino acid biosynthetic pathways. On activation of PDH, however, pyruvate can be decarboxylated to acetyl–coenzyme A, enter the Krebs’ cycle, and complete glucose oxidation in the mitochondrial matrix, generating up to 36 moles of ATP per glucose molecule in the presence of oxygen. Glucose oxidation does not take place when pyruvate does not enter the mitochondria (for example, in diseased mitochondria or if PDH is inhibited) or in the absence of oxygen.
Warburg (6) first showed that the metabolism of cancer cells, even under normoxia, is characterized by an increase in the ratio of cytoplasmic glycolysis to mitochondrial glucose oxidation. Although the mechanism of this “Warburg effect” is unknown, and whether it is etiologically related to carcinogenesis remains unproven (7), there is increasing interest in metabolism as a target for cancer therapies (8–11). The energetic switch from mitochondrial glucose oxidation to cytoplasmic glycolysis may offer a proliferative advantage to cancer cells (11). For example, most glycolytic enzymes also have direct antiapoptotic actions (12); lactic acid promotes angiogenesis and interstitial matrix breakdown, facilitating metastasis (11); and decreased mitochondrial function is associated with inhibition of mitochondriadependent apoptosis (3). GBM has a strong glycolytic phenotype, and a number of the molecular abnormalities that occur in GBM are known to suppress mitochondrial glucose oxidation and promote cytoplasmic glycolysis (1), including the activation of the phosphatidylinositol 3-kinase–AKT or myc pathways or suppression of the p53 pathway (9, 10).
The mitochondria of cancer cells are hyperpolarized, with respect to those of noncancer cells (3, 13), a condition associated with suppressed mitochondrial function. Although controversial [reviewed in (14)], the efflux of proapoptotic mediators through the mitochondrial transition pore (MTP) depends in part on mitochondrial membrane potential (ΔΨm), and thus, mitochondrial hyperpolarization may mark an apoptosis resistance state (3, 15). We have shown that this state can be reversed in cancer cells by DCA, which by inhibiting PDK promotes pyruvate entry into the mitochondria, reversing the increase in glycolysis to glucose oxidation ratio, improving mitochondrial function, and reversing mitochondrial hyperpolarization (3). DCA therefore decreases tumor growth in vitro and in vivo, without affecting noncancer mitochondria and tissues (3, 16–20). The increase in mitochondrial respiration is associated with an increase in production of mitochondrial reactive oxygen species (mROS), predominantly superoxide. Superoxide can be dismutated to H2O2, a relatively stable mROS that can reach other cellular structures beyond the mitochondria. For example, H2O2 can activate redox-sensitive voltage-dependent potassium channels in the plasma membrane and, at least in some tissues, promote a decrease in intracellular calcium (3, 4). Other redox-sensitive targets may include p53, which is activated when oxidized (21, 22). The p53 axis is inhibited in GBM, contributing to the increased proliferative state of GBM cells (1). p53 also represses hypoxia-inducible factor–1α (HIF-1α)–stimulated transcription because p53 and HIF-1α compete for the same cotranscription factor (23, 24). HIF-1α increases the expression of glucose transporters and several glycolytic enzymes as well as PDK, thus sustaining the glycolytic phenotype (25, 26). In addition, HIF-1α increases the expression of vascular endothelial growth factor (VEGF), enhancing angiogenesis. Angiogenesis may also be enhanced by normoxic HIF-1α activation. Because mitochondria are important oxygen sensors (27), inhibited mitochondria may transmit pseudohypoxic redox signals and activate HIF-1α even during normoxia (28–30). In addition, a decrease in α-ketoglutarate, a direct product of the Krebs’ cycle, may also promote HIF activation because it is a cofactor for the prolyl hydroxylation reaction that degrades HIF-1α (30).
We hypothesized that orally administered DCA, which crosses the blood-brain barrier, would decrease GBM growth in vivo. We further suggested that this could occur by (i) reversing the glycolytic phenotype and normalizing ΔΨm, which would promote mitochondria-dependent apoptosis; (ii) increasing mROS and promoting p53 activation; and (iii) increasing α-ketoglutarate concentrations. The last two effects would lead to inhibition of HIF-1α, a decrease in VEGF, and inhibition of angiogenesis.
Results
Effects of DCA on mitochondria from 49 freshly isolated GBM tumors
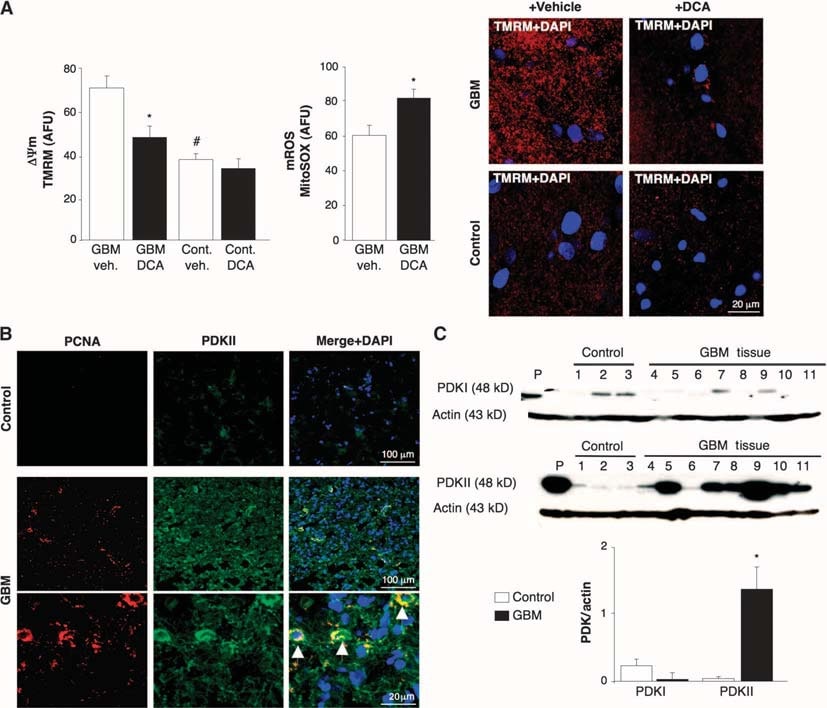
To determine whether human GBM could be a target for metabolic therapy with DCA, we studied 49 freshly excised consecutive primary GBMs (60% male, 48 ± 11 years). In addition to the clinical and neuropathology reports, we confirmed GBM identity with immunohistochemistry, which showed expression of glial fibrillary acidic protein (GFAP) but no bIII-tubulin or oligodendrocyte markers (fig. S1). ΔΨm was increased in the freshly isolated GBMs compared to noncancer brain tissues obtained in epilepsy surgery (n = 3) (Fig. 1A). DCA, but not vehicle (normal saline), caused mitochondrial depolarization in GBM but not in normal brain tissue. DCA also increased GBM mROS (Fig. 1A). This suggested that the metabolic and mitochondrial remodeling in GBM is partially reversible and that this remodeling is at least in part regulated by PDK. The response to DCA is consistent with a higher concentration of PDKII [the most ubiquitously expressed isoform and the one with the lowest Ki for DCA (31)] in GBM than in noncancer brain tissue, as seen with immunohistochemistry and immunoblots (Fig. 1, B and C). Cells exhibiting the highest PDKII concentrations also contained proliferating cell nuclear antigen (PCNA), suggesting that these cells were proliferating (Fig. 1B). These data, collected over a 2-year period, strengthened the rationale for subsequently administering DCA to patients with GBM (4).
Clinical effects of DCA on five patients with GBM
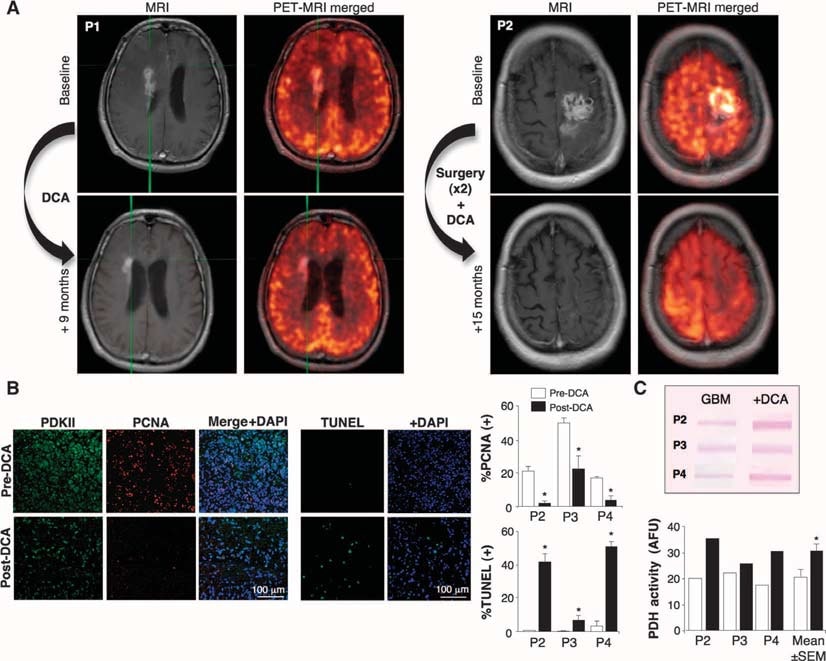
We then treated with DCA five consecutive patients with primary GBM, referred from our brain cancer program and from whom tissue was available from the last debulking surgery. Three patients (patients 1 to 3) had recurrent GBM with disease progression after several chemotherapies (in addition to the standard treatment with surgery, RT, and TMZ) and were considered appropriate for palliative therapy. Two additional patients (patients 4 and 5) were newly diagnosed, and after the initial debulking surgery, DCA was administered in addition to the standard treatment of RT and TMZ. In patient 4, a 3-month pretreatment with DCA was followed by the addition of RT and TMZ, whereas in patient 5 DCA was initiated simultaneously with RT and TMZ, after debulking surgery. If the patients required reoperation or autopsy, tissue from the last debulking surgery (before DCA administration) was compared to the post-DCA treatment tissue. Their clinical information is summarized in table S1. DCA has been administered to patients for >30 years, mainly in the treatment of inborn errors of mitochondrial metabolism, and pharmacokinetic and pharmacodynamic data are available (5, 32–34). We treated patients with a starting dose of 12.5 mg/kg orally twice a day for 1 month, at which point the dose was increased to 25 mg/kg orally twice a day. We then followed a dose de-escalation protocol, decreasing the dose by 50% when dose-limiting toxicity occurred. The patients were followed clinically for up to 15 months. None of the patients had hematologic, hepatic, renal, or cardiac toxicity (table S1). Peripheral neuropathy was the only apparent toxicity. Patients had variable dose-dependent degrees of peripheral neuropathy, which was reversible, confirming previous studies (35–37). When the dose was decreased to 6.25 mg/kg orally twice a day, none of the patients had clinically significant peripheral neuropathy (table S1). Initially, the half-life of DCA is <1 hour. DCA inhibits its own metabolism and serum concentrations increase, eventually reaching a plateau (34). The plasma trough concentrations of DCA in our patients remained undetectable for the first 2 to 3 months but thereafter reached therapeutic concentrations. At a dose of 6.25 mg/kg orally twice a day for at least 3 months, trough DCA concentrations were 0.44 ± 0.16 mM (mean ± SD; n = 4) (table S1). These values are similar to those seen in chronic DCA treatment of adults with mitochondrial defects (34) and are in the same range as the Ki of DCA for PDKII (0.2 mM) (31). Patients 1, 4, and 5 showed some evidence of radiologic regression on magnetic resonance imaging (MRI) (Fig. 2A and figs. S2 to S4). Patient 3 had a very large tumor with brain edema at baseline (fig. S5), despite being on high steroid doses, and a low Karnofsky score and continued to deteriorate. He died from brain edema complications 3 months after initiation of DCA therapy. Patient 2 required drainage of a cyst and debulking in month 11 of DCA therapy. Patient 4 showed radiologic progression on month 3 of DCA therapy, at which point further debulking was performed and RT plus TMZ was given in addition to DCA. All, except patient 3, were clinically stable at month 15 of DCA therapy and alive at month 18 (telephone follow-up). Further clinical details are described in the Supplementary Material.
Effects of DCA on GBM tumors in vivo, primary GBM cell lines, and putative GBM-SC derived from the DCA-treated patients
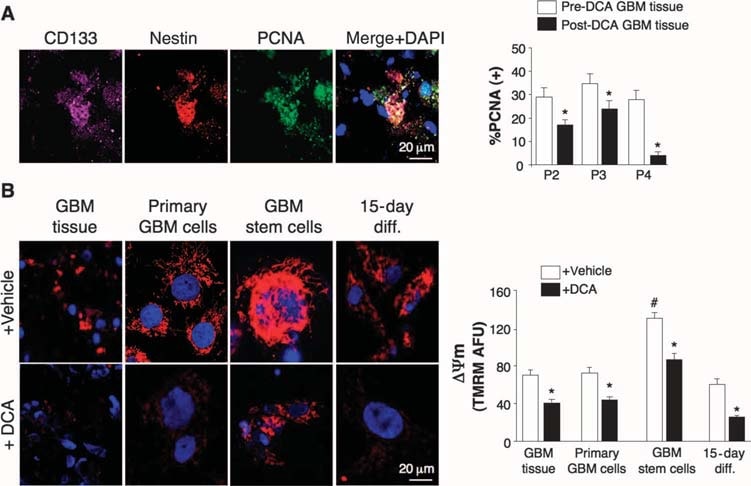
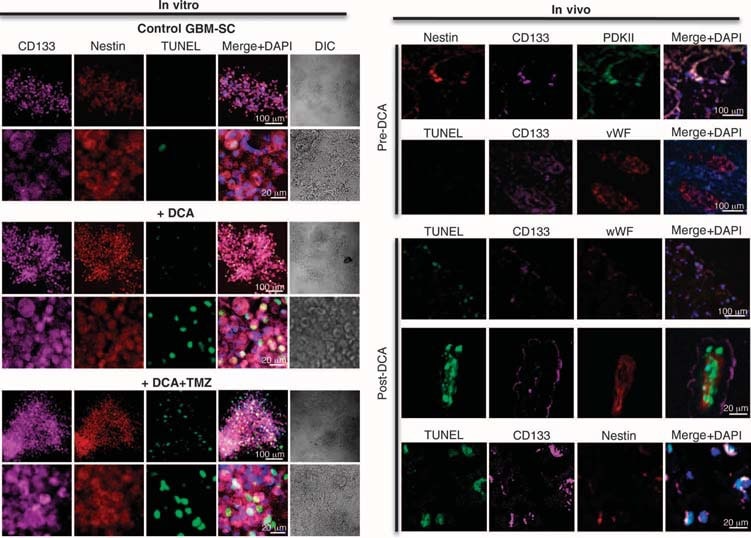
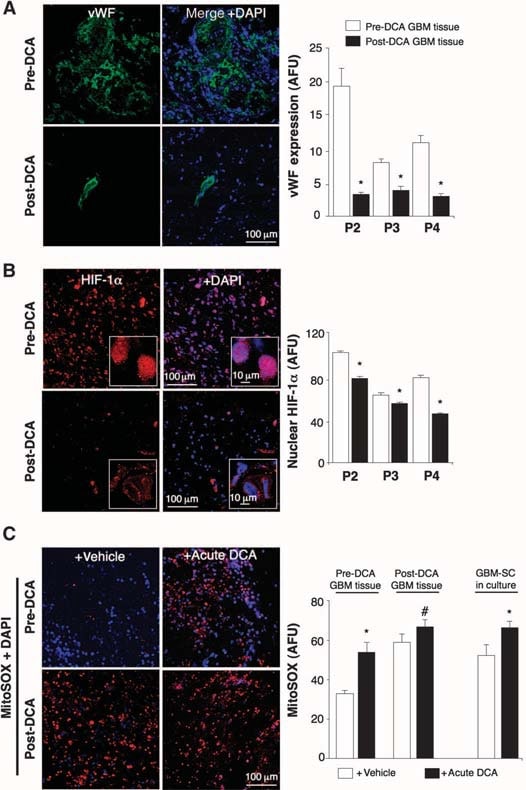
We conducted experiments on tissues derived from these five patients and were able to make comparisons in tissues before and after DCA treatment in patients 2 to 4; we only had “before” tissues in patients 1 and 5. Compared to pre-DCA tissue, post-DCA GBM tissue in all three patients showed decreased number of cells per unit volume, decreased proliferation, and increased apoptosis (Fig. 2B), as well as increased tissue enzymatic activity of PDH, suggesting effective inhibition of PDK in vivo (Fig. 2C). Putative GBM cancer stem cells (GBM-SCs) may be responsible for posttreatment resistance and recurrence of GBM (38–43). These cells are characterized as CD133+ / nestin+ GBM-SC and form niches around capillaries (41). In such vascular GBM-SC units, GBM-SC can induce angiogenesis, whereas their molecular stem cell phenotype is maintained by their accessibility to circulating growth factors (44). GBM-SC proliferation is associated with particularly poor clinical outcome (42). CD133+ /nestin+ GBM-SC expressed PCNA in vivo in all pre-DCA tumors, indicating that they are dividing, but the percentage of CD133+ / nestin+ cells that expressed PCNA was significantly decreased after DCA therapy in patients 2 to 4 (Fig. 3A). Simultaneous staining with a CD133 antibody and tetramethyl rhodamine methyl ester (TMRM) showed that CD133+ cells had the highest ΔΨm compared to neighboring non–GBM-SC in vivo (fig. S6). In tumor-derived primary cell lines, ~10% of cells expressed both CD133 and nestin, whereas >90% of the cells expressed the mature marker GFAP (but not bIII-tubulin or oligodendrocyte) (fig. S7), similar to the histopathology of GBM (fig. S1). We isolated putative GBM-SC from GBM tumors and cultured them with the appropriate growth factors (human fibroblast growth factor, 20 ng/ml; human epidermal growth factor, 20 ng/ml). These cells had a very high expression of both CD133 and nestin, had very low expression of mature glial markers (fig. S7), and formed characteristic neurospheres (Fig. 4 and fig. S7), an independent predictor of poor clinical outcome (43). We measured DYm in freshly excised tumors, in primary cell lines, and in GBM-SC isolated from those tumors as well as in differentiated cells derived from GBM-SC (Fig. 3B). The highest potential was found in the putative GBM-SC. Both the primary and the GBM-SC–derived secondary GBM cells (15-day differentiation) had mitochondrial potentials similar to that of the parent tumors. DCA (0.5 mM for 24 hours) decreased the potential in all groups of cells. Although the cause of the increased ΔΨm in cancer (3, 13) remains to be fully defined, it has been proposed to be caused in part by a translocation of hexokinase II (HXKII), a key glycolytic enzyme, from the cytoplasm to the outer mitochondrial membrane (45, 46). There, HXKII may bind to and inhibit the voltage-dependent anion channel (a component of the MTP), increasing the ΔΨm and the apoptotic threshold. Inhibition of this translocation decreases cancer ΔΨm and reverses the resistance to apoptosis (45, 46). Our primary cell lines generated from pre-DCA tumors showed a sustained mitochondrial translocation of HXKII, potentially explaining the increase in ΔΨm. HXKII translocation was not present in primary cell lines from tumors after DCA treatment (fig. S8), compatible with the notion that DCA induced suppression of glycolysis and decreased ΔΨm. As in the tumors, PDKII was present at high concentrations in the GBM cell lines generated from patients 2 to 4, although the other known isoenzymes were also expressed (fig. S9A). When GBM-SCs were allowed to differentiate into secondary GBM cell lines, the proportion of cells with GBM-SC markers decreased to a value similar to that of the primary cell lines (~10%). When allowed to differentiate in the presence of DCA (0.5 mM), however, the proportion of cells with GBM-SC markers was decreased even further to ~5% (fig. S7). Indeed, DCA induced apoptosis in GBM-SC in vitro (Fig. 4 and fig. S9B) as well as in GBM primary cell lines (fig. S9C). Apoptosis was further increased in GBM-SCs by the combination of DCA plus TMZ (Fig. 4 and fig. S9B), providing a rationale for combination therapy. GBM-SC apoptosis also took place in vivo in the post-DCA treatment tumors, shown by the colocalization of nestin, CD133, and terminal deoxynucleotidyl transferase–mediated deoxyuridine triphosphate nick end labeling (TUNEL) staining (Fig. 4 and fig. S9D).
Effects of DCA on the GBM-SC microvessel unit and angiogenesis in vivo and in vitro
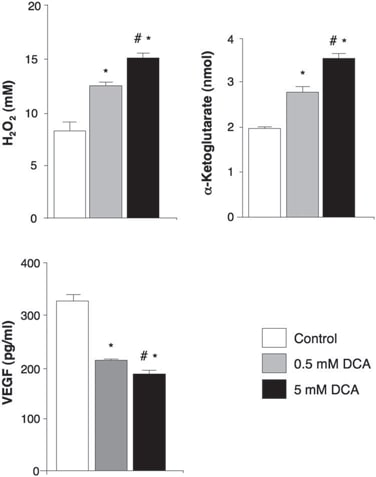
In the untreated, pre-DCA tissues, niches of GBM-SC were found around microvessel beds [von Willebrand factor (vWF) staining], as reported (41). This GBM-SC microvessel unit (44) was destroyed by DCA treatment because, in addition to GBM-SC, apoptosis was also increased in microvascular endothelial cells (Fig. 4 and fig. S9D), suggesting a potential inhibition of angiogenesis. Indeed, decreased vWF staining in post-DCA treatment tumors suggested that there was decreased vascularity (Fig. 5A). HIF-1α was highly expressed or activated (nuclear localization) in the pre-DCA and inhibited in the post-DCA tumor tissues (Fig. 5B). Post-DCA treatment tumors from patients 2 to 4 showed a significant increase in mROS in vivo (superoxide measured by mitoSOX) compared to the pre-DCA tumors from the same patients (Fig. 5C). In the preDCA tumors, acute DCA increased mROS to values seen in the post-DCA treatment tumors. In contrast, in the post-DCA tumors, acute DCA only minimally increased mROS, suggesting an almost maximal effect in vivo. DCA increased mROS in GBM-SC as well (Fig. 5C). Low ROS concentrations in cancer stem cells may reflect resistance to apoptosis, and therapies that increase cancer stem cell ROS are suggested to be more effective (47). Although we studied mROS (mitochondrial superoxide), controversy exists whether HIF-1α activation in cancer is associated with an overall increase or decrease in ROS [reviewed in (28)]. Using a different technique, we also measured whole-cell H2O2. DCA increased GBM cell H2O2 in a dose-dependent manner (Fig. 6). In addition, DCA also increased intracellular α-ketoglutarate concentrations in a dose-dependent manner (Fig. 6). This is compatible with the increase in glucose oxidation that follows PDH activation (3) because α-ketoglutarate is a product of the Krebs’ cycle. The Krebs’ cycle produces the electron donors that feed into the electron transport chain during respiration. Accordingly, DCA increased respiration rates by 44 ± 4% in GBM cells (mean ± SEM; n = 3; P < 0.05), supporting an overall increase in mitochondrial activity. The increase in H2O2 and α-ketoglutarate can explain the decrease in HIF-1α activity (Fig. 5B), which is also confirmed by the dose-dependent decrease in VEGF production by GBM cells (Fig. 6). These data are consistent with the decrease in the angiogenesis in vivo (Figs. 4 and 5) and suggest that GBM cells signal to endothelial cells in a paracrine manner. To study whether DCA can directly suppress angiogenesis, we used the standard technique of human endothelial cell tube formation in Matrigel. Under physiologic moderate hypoxia, DCA caused a dose-dependent direct inhibition of angiogenesis in vitro (fig. S10). The post-DCA treatment tumors from patients 2 to 4 showed increased activity of the mROS-sensitive p53 (nuclear translocation), also confirmed by the increased activity and abundance of its downstream target p21 (fig. S11). These effects on p53 or p21 can also explain the decrease in HIF-driven transcription and are consistent with the antiproliferative, in addition to the proapoptotic, effects of DCA in GBM (fig. S12).
DISCUSSION
The metabolic modulator DCA exerts anticancer effects in cultured cells and rodents (3, 16–20). We have now shown that DCA can be used in patients suffering from GBM. DCA treatment was associated in some GBM patients with prolonged radiologic stabilization or tumor regression and, in general, displayed an overall good safety profile. This early, first-in-human report provides a rationale for extended studies with this generic small molecule in patients with GBM. Our results indicate that GBM is a good candidate for metabolic intervention. The target of DCA, PDKII, is highly expressed in GBM tumors and cell lines, and DCA can inhibit its activity in vivo. GBM is characterized by mitochondrial hyperpolarization, in keeping with the metabolic remodeling (Warburg effect) and the related apoptosis resistance that characterize GBM and most solid tumors (11). Mutations in the genes for cytoplasmic and mitochondrial isocitrate dehydrogenases have been described in GBMs arising from lowergrade gliomas (secondary GBMs) (48), but the mechanism by which these mutations relate to carcinogenesis remains unclear (49, 50). Our patients had primary GBMs and the mitochondrial remodeling was at least partially reversible with DCA, suggesting that it was not due to irreversible dysfunction. Furthermore, we show that putative GBM-SC may undergo the same metabolic and mitochondrial remodeling, but to an enhanced degree, because GBM-SC had the most hyperpolarized mitochondria both in vivo and in vitro. Reversal of this mitochondrial remodeling by DCA induced apoptosis in GBM-SC both in vitro and in vivo. Although the magnitude of apoptosis induction by DCA is not high (compared to cytotoxic agents), it is relatively selective, sparing noncancer cells (3), and, because it involves GBM-SC, may result in a more sustained clinical effect. Patient 3 died and patient 4 had a recurrence within the first 3 months when DCA had not achieved sustained therapeutic values (as shown by the fact that trough plasma concentrations were undetectable). Thus, patients may be undertreated on initial DCA administration and at risk of initial disease progression. By decreasing the resistance to mitochondrialdependent apoptosis, DCA may be able to potentiate the effects of standard therapies. Indeed, the effects of DCA plus TMZ on GBMSC apoptosis could underlie the long-term benefits experienced by patient 5. The effects of DCA on cancer cells are mimicked by PDKII small interfering RNA, and DCA does not have any effects beyond those seen after PDKII knockdown (3). This suggests that the mechanism of the anticancer effects of DCA is the inhibition of PDKII, an enzyme that is found at increased concentrations in GBM. By inhibiting PDKII, DCA normalizes the increased glycolysis to glucose oxidation ratio in cancer cells, increasing mitochondrial function (3). This mechanism is supported by our current findings that DCA increases both GBM cell respiration and a-ketoglutarate concentration. However, in contrast to the controlled conditions of cell culture, additional mechanisms may contribute to the effects of DCA on cancer cell metabolism and apoptosis in vivo. In addition to the previously described effects of DCA on cancer cells (3), our data on HXKII, mROS, HIF-1α, p53, and p21 are consistent with DCA-induced inhibition of angiogenesis, induction of apoptosis, and suppression of proliferation in both GBM and GBM-SC, as summarized in the Supplementary Material and fig. S12. DCA had no apparent toxicity other than a previously described dose-dependent, reversible nondemyelinating neurotoxicity (32, 34) that was minimal or absent at the 6.25 mg/kg oral, twicea-day dose. This dose showed biologic and clinical efficacy and achieved plasma concentrations at values required for PDK inhibition (31). With the small number of treated patients in our study, no firm conclusions regarding DCA as a therapy for GBM can be made. Our work supports the need for further studies with DCA in GBM, with an emphasis on combination therapy protocols. GBM may also be vulnerable to other drugs in the emerging family of metabolic modulators, pointing to a new approach in the management of this incurable cancer.
SUPPLEMENTARY MATERIAL
www.sciencetranslationalmedicine.org/cgi/content/full/2/31/31ra34/DC1
Materials and Methods
Results
Discussion
Fig. S1. Molecular characterization of GBM tumors.
Fig. S2. Evolution of tumor response in patient 1.
Fig. S3. Evolution of tumor response in patient 4.
Fig. S4. Evolution of tumor response in patient 5.
Fig. S5. GBM MRI from patient 3.
Fig. S6. Mitochondrial membrane potential in GBM-SC from freshly excised GBM tissue.
Fig. S7. Characterization of primary GBM cells and GBM-SC.
Fig. S8. HXKII in GBM cells derived from patients before and after chronic DCA treatment.
Fig. S9 Effects of DCA therapy on GBM-SC and vascular apoptosis.
Fig. S10. Effects of DCA on angiogenesis in vitro.
Fig. S11. Effects of DCA treatment on p53 and p21 activity in vivo.
Fig. S12. A proposed comprehensive mechanism for the anticancer effects of DCA in GBM (see
Supplementary Discussion).
Table S1. Laboratory and clinical parameters of five GBM patients before and after DCA treatment.
References
REFERENCES
1 1. P. Y. Wen, S. Kesari, Malignant gliomas in adults. N. Engl. J. Med. 359, 492–507 (2008).
2 W. K. Yung, R. E. Albright, J. Olson, R. Fredericks, K. Fink, M. D. Prados, M. Brada, A. Spence, R. J. Hohl, W. Shapiro, M. Glantz, H. Greenberg, R. G. Selker, N. A. Vick, R. Rampling, H. Friedman, P. Phillips, J. Bruner, N. Yue, D. Osoba, S. Zaknoen, V. A. Levin, A phase II study of temozolomide vs. procarbazine in patients with glioblastoma multiforme at first relapse. Br. J. Cancer 83, 588–593 (2000).
3 S. Bonnet, S. L. Archer, J. Allalunis-Turner, A. Haromy, C. Beaulieu, R. Thompson, C. T. Lee, G. D. Lopaschuk, L. Puttagunta, S. Bonnet, G. Harry, K. Hashimoto, C. J. Porter, M. A. Andrade, B. Thebaud, E. D. Michelakis, A mitochondria-K+ channel axis is suppressed in cancer and its normalization promotes apoptosis and inhibits cancer growth. Cancer Cell 11, 37–51 (2007).
4 E. D. Michelakis, L. Webster, J. R. Mackey, Dichloroacetate (DCA) as a potential metabolictargeting therapy for cancer. Br. J. Cancer 99, 989–994 (2008).
5 P. W. Stacpoole, The pharmacology of dichloroacetate. Metabolism 38, 1124–1144 (1989).
6 O. Warburg, Ueber den Stoffwechsel der Tumoren (Constable, London, 1930).
7 S. Weinhouse, The Warburg hypothesis fifty years later. Z. Krebsforsch. Klin. Onkol. Cancer Res. Clin. Oncol. 87, 115–126 (1976).
8 M. G. Vander Heiden, L. C. Cantley, C. B. Thompson, Understanding the Warburg effect: The metabolic requirements of cell proliferation. Science 324, 1029–1033 (2009).
9 J. G. Pan, T. W. Mak, Metabolic targeting as an anticancer strategy: Dawn of a new era? Sci. STKE 2007, pe14 (2007).
10 J. W. Kim, C. V. Dang, Cancer’s molecular sweet tooth and the Warburg effect. Cancer Res. 66, 8927–8930 (2006).
11 R. A. Gatenby, R. J. Gillies, Why do cancers have high aerobic glycolysis? Nat. Rev. Cancer 4, 891–899 (2004).
12 J. W. Kim, C. V. Dang, Multifaceted roles of glycolytic enzymes. Trends Biochem. Sci. 30, 142–150 (2005).
13 L. B. Chen, Mitochondrial membrane potential in living cells. Annu. Rev. Cell Biol. 4, 155–181 (1988).
14 G. Kroemer, L. Galluzzi, C. Brenner, Mitochondrial membrane permeabilization in cell death. Physiol. Rev. 87, 99–163 (2007).
15. N. Zamzami, G. Kroemer, The mitochondrion in apoptosis: How Pandora’s box opens. Nat. Rev. Mol. Cell Biol. 2, 67–71 (2001).
16 R. A. Cairns, I. Papandreou, P. D. Sutphin, N. C. Denko, Metabolic targeting of hypoxia and HIF1 in solid tumors can enhance cytotoxic chemotherapy. Proc. Natl. Acad. Sci. U.S.A. 104, 9445–9450 (2007).
17 W. Cao, S. Yacoub, K. T. Shiverick, K. Namiki, Y. Sakai, S. Porvasnik, C. Urbanek, C. J. Rosser, Dichloroacetate (DCA) sensitizes both wild-type and over expressing Bcl-2 prostate cancer cells in vitro to radiation. Prostate 68, 1223–1231 (2008).
18 S. Dhar, S. J. Lippard, Mitaplatin, a potent fusion of cisplatin and the orphan drug dichloroacetate. Proc. Natl. Acad. Sci. U.S.A. 106, 22199–22204 (2009).
19 R. C. Sun, M. Fadia, J. E. Dahlstrom, C. R. Parish, P. G. Board, A. C. Blackburn, Reversal of the glycolytic phenotype by dichloroacetate inhibits metastatic breast cancer cell growth in vitro and in vivo. Breast Cancer Res. Treat. 120, 253–260 (2010).
20 J. Y. Wong, G. S. Huggins, M. Debidda, N. C. Munshi, I. De Vivo, Dichloroacetate induces apoptosis in endometrial cancer cells. Gynecol. Oncol. 109, 394–402 (2008).
21 S. Wang, S. S. Leonard, J. Ye, M. Ding, X. Shi, The role of hydroxyl radical as a messenger in Cr(VI)-induced p53 activation. Am. J. Physiol. Cell Physiol. 279, C868–C875 (2000).
22 C. Huang, Z. Zhang, M. Ding, J. Li, J. Ye, S. S. Leonard, H. M. Shen, L. Butterworth, Y. Lu, M. Costa, Y. Rojanasakul, V. Castranova, V. Vallyathan, X. Shi, Vanadate induces p53 transactivation through hydrogen peroxide and causes apoptosis. J. Biol. Chem. 275, 32516–32522 (2000).
23 T. Schmid, J. Zhou, R. Köhl, B. Brüne, p300 relieves p53-evoked transcriptional repression of hypoxia-inducible factor-1 (HIF-1). Biochem. J. 380, 289–295 (2004).
24 M. V. Blagosklonny, W. G. An, L. Y. Romanova, J. Trepel, T. Fojo, L. Neckers, p53 inhibits hypoxia-inducible factor-stimulated transcription. J. Biol. Chem. 273, 11995–11998 (1998).
25 J. W. Kim, I. Tchernyshyov, G. L. Semenza, C. V. Dang, HIF-1-mediated expression of pyruvate dehydrogenase kinase: A metabolic switch required for cellular adaptation to hypoxia. Cell Metab. 3, 177–185 (2006).
26 G. L. Semenza, D. Artemov, A. Bedi, Z. Bhujwalla, K. Chiles, D. Feldser, E. Laughner, R. Ravi, J. Simons, P. Taghavi, H. Zhong, ‘The metabolism of tumours’: 70 years later. Novartis Found. Symp. 240, 251–260 (2001).
27 E. K. Weir, J. López-Barneo, K. J. Buckler, S. L. Archer, Acute oxygen-sensing mechanisms. N. Engl. J. Med. 353, 2042–2055 (2005).
28 N. C. Denko, Hypoxia, HIF1 and glucose metabolism in the solid tumour. Nat. Rev. Cancer 8, 705–713 (2008).
29 G. L. Semenza, Targeting HIF-1 for cancer therapy. Nat. Rev. Cancer 3, 721–732 (2003).
30 E. D. MacKenzie, M. A. Selak, D. A. Tennant, L. J. Payne, S. Crosby, C. M. Frederiksen, D. G. Watson, E. Gottlieb, Cell-permeating a-ketoglutarate derivatives alleviate pseudohypoxia in succinate dehydrogenase-deficient cells. Mol. Cell. Biol. 27, 3282–3289 (2007).
31 M. M. Bowker-Kinley, W. I. Davis, P. Wu, R. A. Harris, K. M. Popov, Evidence for existence of tissue-specific regulation of the mammalian pyruvate dehydrogenase complex. Biochem. J. 329 (Pt 1), 191–196 (1998).
32 P. W. Stacpoole, D. S. Kerr, C. Barnes, S. T. Bunch, P. R. Carney, E. M. Fennell, N. M. Felitsyn, R. L. Gilmore, M. Greer, G. N. Henderson, A. D. Hutson, R. E. Neiberger, R. G. O’Brien, L. A. Perkins, R. G. Quisling, A. L. Shroads, J. J. Shuster, J. H. Silverstein, D. W. Theriaque, E. Valenstein, Controlled clinical trial of dichloroacetate for treatment of congenital lactic acidosis in children. Pediatrics 117, 1519–1531 (2006).
33 P. W. Stacpoole, A. C. Lorenz, R. G. Thomas, E. M. Harman, Dichloroacetate in the treatment of lactic acidosis. Ann. Intern. Med. 108, 58–63 (1988).
34 P. W. Stacpoole, T. L. Kurtz, Z. Han, T. Langaee, Role of dichloroacetate in the treatment of genetic mitochondrial diseases. Adv. Drug Deliv. Rev. 60, 1478–1487 (2008).
35 P. Kaufmann, K. Engelstad, Y. Wei, S. Jhung, M. C. Sano, D. C. Shungu, W. S. Millar, X. Hong, C. L. Gooch, X. Mao, J. M. Pascual, M. Hirano, P. W. Stacpoole, S. DiMauro, D. C. De Vivo, Dichloroacetate causes toxic neuropathy in MELAS: A randomized, controlled clinical trial. Neurology 66, 324–330 (2006).
36 P. W. Stacpoole, L. R. Gilbert, R. E. Neiberger, P. R. Carney, E. Valenstein, D. W. Theriaque, J. J. Shuster, Evaluation of long-term treatment of children with congenital lactic acidosis with dichloroacetate. Pediatrics 121, e1223–e1228 (2008).
37 P. W. Stacpoole, G. N. Henderson, Z. Yan, M. O. James, Clinical pharmacology and toxicology of dichloroacetate. Environ. Health Perspect. 106 (Suppl. 4), 989–994 (1998).
38 N. Sanai, A. Alvarez-Buylla, M. S. Berger, Neural stem cells and the origin of gliomas. N. Engl. J. Med. 353, 811–822 (2005).
39 F. Zindy, T. Uziel, O. Ayrault, C. Calabrese, M. Valentine, J. E. Rehg, R. J. Gilbertson, C. J. Sherr, M. F. Roussel, Genetic alterations in mouse medulloblastomas and generation of tumors de novo from primary cerebellar granule neuron precursors. Cancer Res. 67, 2676–2684 (2007).
40 T. Hide, T. Takezaki, H. Nakamura, J. Kuratsu, T. Kondo, Brain tumor stem cells as research and treatment targets. Brain Tumor Pathol. 25, 67–72 (2008).
41 C. Calabrese, H. Poppleton, M. Kocak, T. L. Hogg, C. Fuller, B. Hamner, E. Y. Oh, M. W. Gaber, D. Finklestein, M. Allen, A. Frank, I. T. Bayazitov, S. S. Zakharenko, A. Gajjar, A. Davidoff, R. J. Gilbertson, A perivascular niche for brain tumor stem cells. Cancer Cell 11, 69–82 (2007).
42 R. Pallini, L. Ricci-Vitiani, G. L. Banna, M. Signore, D. Lombardi, M. Todaro, G. Stassi, M. Martini, G. Maira, L. M. Larocca, R. De Maria, Cancer stem cell analysis and clinical outcome in patients with glioblastoma multiforme. Clin. Cancer Res. 14, 8205–8212 (2008).
43 D. R. Laks, M. Masterman-Smith, K. Visnyei, B. Angenieux, N. M. Orozco, I. Foran, W. H. Yong, H. V. Vinters, L. M. Liau, J. A. Lazareff, P. S. Mischel, T. F. Cloughesy, S. Horvath, H. I. Kornblum, Neurosphere formation is an independent predictor of clinical outcome in malignant glioma. Stem Cells 27, 980–987 (2009).
44 R. J. Gilbertson, J. N. Rich, Making a tumour’s bed: Glioblastoma stem cells and the vascular niche. Nat. Rev. Cancer 7, 733–736 (2007).
45 J. G. Pastorino, J. B. Hoek, Hexokinase II: The integration of energy metabolism and control of apoptosis. Curr. Med. Chem. 10, 1535–1551 (2003).
46 J. G. Pastorino, J. B. Hoek, N. Shulga, Activation of glycogen synthase kinase 3b disrupts the binding of hexokinase II to mitochondria by phosphorylating voltage-dependent anion channel and potentiates chemotherapy-induced cytotoxicity. Cancer Res. 65, 10545–10554 (2005).
47M. Diehn, R. W. Cho, N. A. Lobo, T. Kalisky, M. J. Dorie, A. N. Kulp, D. Qian, J. S. Lam, L. E. Ailles, M. Wong, B. Joshua, M. J. Kaplan, I. Wapnir, F. M. Dirbas, G. Somlo, C. Garberoglio, B. Paz, J. Shen, S. K. Lau, S. R. Quake, J. M. Brown, I. L. Weissman, M. F. Clarke, Association of reactive oxygen species levels and radioresistance in cancer stem cells. Nature 458, 780–783 (2009).
48 H. Yan, D. W. Parsons, G. Jin, R. McLendon, B. A. Rasheed, W. Yuan, I. Kos, I. Batinic-Haberle, S. Jones, G. J. Riggins, H. Friedman, A. Friedman, D. Reardon, J. Herndon, K. W. Kinzler, V. E. Velculescu, B. Vogelstein, D. D. Bigner, IDH1 and IDH2 mutations in gliomas. N. Engl. J. Med. 360, 765–773 (2009).
49 C. B. Thompson, Metabolic enzymes as oncogenes or tumor suppressors. N. Engl. J. Med. 360, 813–815 (2009).
50 L. Dang, D. W. White, S. Gross, B. D. Bennett, M. A. Bittinger, E. M. Driggers, V. R. Fantin, H. G. Jang, S. Jin, M. C. Keenan, K. M. Marks, R. M. Prins, P. S. Ward, K. E. Yen, L. M. Liau, J. D. Rabinowitz, L. C. Cantley, C. B. Thompson, M. G. Vander Heiden, S. M. Su, Cancer-associated IDH1 mutations produce 2-hydroxyglutarate. Nature 462, 739–744 (2009).
51 Funding: This study was funded by the Hecht Foundation (Vancouver, British Columbia, Canada; E.D.M.), the Canada Institutes for Health Research and the Canada Research Chairs Program (E.D.M.), and by public donations to the DCA program (received and managed by the Regents of the University of Alberta and the Faculty of Medicine). The authors would like to acknowledge the support from the Alberta Health Services (D. Gordon, Senior VicePresident, Major Tertiary Hospitals). Author contributions: E.D.M. designed the studies, supervised the mechanistic studies, secured the funding, analyzed the data, and wrote the manuscript. K.C.P. co-designed the studies, supervised all clinical studies, and co-wrote the manuscript. G.S. and P.D. performed all the mechanistic studies and edited the manuscript. L.W. coordinated all studies, contributed to data acquisition, analyzed the clinical data, and edited the manuscript. A.H., E.N., C.M., T.-L.G., and M.S.M. contributed to data acquisition and data analysis and edited the manuscript. J.R.M., D.F., and B.A. co-designed the clinical studies, contributed to data acquisition, and edited the manuscript. Competing interests: E.D.M. is the co-owner of a pending use patent on the use of DCA as a cancer therapy. There has been no active or planned commercialization of this patent.