Zaida Torres-Cavazos1, Moisés Armides Franco-Molina2, Silvia Elena Santana-Krímskaya2, Cristina Rodríguez-Padilla2, Jorge Ramsy Kawas-Garza1, Gustavo Hernández-Vidal1, Gustavo Moreno-Degollado1, and Diana Elisa Zamora-Ávila1
1 Posgrado Conjunto de las Facultades de Agronomía y Medicina Veterinaria y Zootecnia, Universidad Autónoma de Nuevo León,
Ave. Universidad S/N, Cd. Universitaria, San Nicolás de los Garza, N. L., CP 66455, Mexico
2 Laboratorio de Inmunología y Virología, Unidad C, Facultad de Ciencias Biológicas, Universidad Autónoma de Nuevo León,
Ave. Universidad S/N, Cd. Universitaria, San Nicolás de los Garza, N. L., CP 66455, Mexico
Correspondence: Moisés Armides Franco-Molina; [email protected]
Received: 13 July 2020
Revised: 28 September 2020
Accepted: 14 October 2020
Published: 7 November 2020
Abstract
Our main focus was to evaluate the efficacy of silver and sodium dichloroacetate as dual-function agents to be used in melanoma treatment. This strategy is designed to increase the activity of these two compounds that affect DNA integrity and the mitochondria at different levels. Furthermore, we evaluated if the cell death mechanism induced by our treatments was immunogenic cell death. To evaluate antitumor efficacy, we assessed tumor volume and production of tumor necrosis factor-α, nuclear factor κ B (both by ELISA), and nitric oxide levels (Nitrate/Nitrite colorimetric assay kit); for immunogenic cell death, we evaluated the release of danger-associated molecular patterns using immunohistochemistry and flow cytometry, as well as an in vivo challenge. Our results showed that the combination of colloidal silver and sodium dichloroacetate is more effective than each treatment alone and that the antitumor mechanism is not through immunogenic cell death. Furthermore, this study can broadly contribute to the development of dichloroacetate-loaded silver nanoparticles and to the design targeted pharmacological formulations to fight melanoma as well as other types of cancer.
Academic Editor: Yanis Toledaño Magaña
Copyright © 2020 Zaida Torres-Cavazos et al. This is an open access article distributed under the Creative Commons Attribution License, which permits unrestricted use, distribution, and reproduction in any medium, provided the original work is properly cited.
INTRODUCTION
Targeted therapies have increased the chances of survival for people with melanoma [1]; however, cancer cells present within the tumor favor different metabolic pathways [2]; as a consequence, the tumor eventually becomes resistant to targeted therapies, especially the ones designed against a single target [3].
The development of silver-based therapies is a promising tool in cancer treatment. Silver ions and silver nanoparticles induce oxidative stress, mitochondrial membrane dysfunction, DNA damage, and cytokines upregulation [4]. The exact action mechanism varies depending on the physical and chemical properties of the nanoparticle and the type of cancer [5]. Furthermore, the clinical use of colloidal silver for bactericidal and antiviral purposes proves that this treatment is safe [6],
7].
Sodium dichloroacetate (DCA) is a pyruvate analog which interferes with tumor-associated glycolysis (Warburg effect), decreases cancer malignancy, and reduces lactate production by altering cancer cell metabolic pathways [8]. A decrease in lactate counteracts the acidic state of tumoral microenvironment, reducing tumor growth and metastasis [8]. WZB117, a bis-hydroxybenzoate, 2-deoxy-d-glucose, metformin, and DCA reduce glycolysis and block glucose uptake in cancer cells. Under low intracellular glucose levels, biosynthetic pathways, such as nucleotides and amino acids genesis, are interrupted due to a shortage of intermediate molecules, putting a break on cell proliferation. Despite of its use as monotherapy or combined with chemotherapy, few or none adverse effects have been reported [9].
Because of these activities, we evaluated immunogenic cell death as a possible action mechanism, owing to the increasing number of studies that demonstrate that cellular and mitochondrial danger-associated molecular patterns (DAMPs) can be actively released when exposed to external stimuli [10]. The release of alarmins (Hsp70, HSP90, calreticulin, HMGB1, ATP, DNA, and RNA) and tumor neoantigens induce a tumor-specific immune response that eliminates live cancer cells and residual tumor tissue, avoiding cancer recurrence [11].
The main focus of this study was to use silver and DCA as dual-function agents that affect the DNA integrity and mitochondria activity in order to increase the antitumor response in melanoma treatment. Furthermore, this study could serve as a starting point for the next level developmental stage of dichloroacetate-loaded silver nanoparticles targeted pharmacological formulation.
Materials and Methods
Reagents
Penicillin-streptomycin solution, Ficoll-Hypaque solution, trypsin-EDTA solution, RPMI-1640 medium, Dulbecco’s Modified Eagle’s Medium (DMEM/F-12), and 1% antibiotic-antimycotic solution were obtained from Life Technologies GIBCO, Grand Island, NY, USA. Fetal bovine serum (FBS) was purchased from Sigma-Aldrich (St. Louis, MO).
Cell Culture
B16F10 murine melanoma cell line was purchased from American Type Culture Collection (ATCC, Manassas, VA, USA). Cells were grown and maintained in Dulbecco’s Modified Eagle’s Medium supplemented with 10% fetal bovine serum (FBS) and 1% penicillin-streptomycin solution at 37°C and 5% CO2 atmosphere.
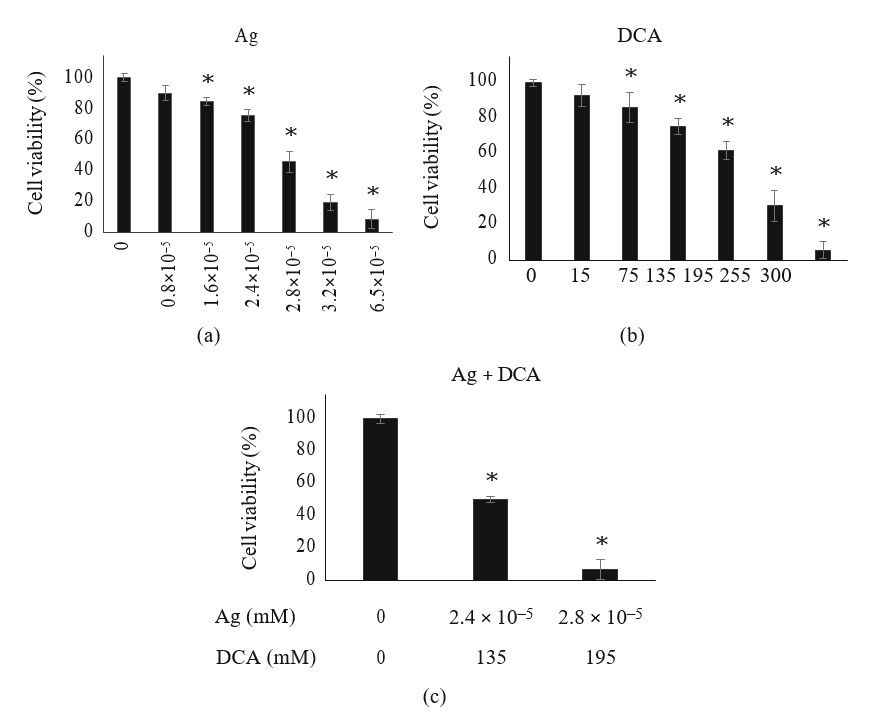
Cell Viability
ells (5 × 10³ cells/well) were plated on 96 flat-bottom well plates and incubated for 24 h at 37°C in 5% CO2 atmosphere. After incubation, culture medium was removed, and Ag (0.8mM to 6:5 × 10⁻⁵mM) or DCA (75mM/ml to 750mM/ml) diluted in the same medium were added. The plates were then incubated for 4h at 37°C and 5% CO2 atmosphere. Thereafter, the supernatant was removed, and cells were washed twice with DMEM/F-12 medium. Cell viability was determined by the resazurin (Alamar Blue) method, and cytotoxicity was expressed as the concentration of 50% cell growth inhibition (LD50). Results were given as the mean ± standard deviation (SD) of three independent experiments. The LD50 of each treatment was used in further experiments.
Cell Death Determination
For cell death determination, we followed the methodology described by Rodríguez-Salazar et al. [12]. Briefly, B16F10 cells (1 × 10⁵) were seeded into 12-well plates and cultured overnight in 5% CO2 at 37°C. Cells were treated with AgC (LD50) or DCA (LD50) or a combination of AgC (LD25) + DCA (LD25) for 5h. Following treatment, cells were collected and washed with phosphate-buffered saline (PBS) and resuspended in 100μl of 1× binding buffer (0.1M Hepes pH 7.4, 1.4M NaCl, and 25 mM CaCl2; Sigma-Aldrich; Merck KGaA, Darmstadt, Germany) supplemented with APC-conjugated Annexin V (5μl/sample) and propidium iodide (1μl/sample), incubated on at 4°C, and kept in the dark for 15 min. Flow cytometry analysis was performed using an Accuri C6 cytometer; the BD Accuri C6 Software version 1.0.264.21 was used for data analysis (both BD Biosciences, San Jose, CA, USA).
Animals
Female C57BL/6 mice aged 6 and 10 weeks with a body weight around 23 (±2) g were purchased from the Harlan Laboratories (Mexico City, Mexico). The mice were kept at 25–29°C and a 12h light to 12h dark cycle. Food and water were provided ad libitum. The experimental protocol was approved by the Ethics Review Committee for Animal Experimentation of the Biological Sciences Faculty, Autonomous University of Nuevo Leon (San Nicolas de los Garza, Mexico).
Tumor Implantation and Treatment Administration
Tumors were induced subcutaneously by injecting 1 x 10⁶ B16F10 cells in 200 μl of phosphate buffered saline (PBS) solution. Seven days after B16F10 cell transplantation, a noticeable tumor mass appeared, and mice were distributed randomly into four groups (five mice per group). The control group received only saline solution. The DCA group received 50mg/kg of DCA, whereas the Ag group received 28mg/kg of Ag. Saline solution, Ag, and DCA were administrated by peritumor route, daily, for 21 days. Finally, the Ag + DCA group received the same of doses Ag and DCA by peritumor route every other day, alternating between treatments. Tumor length and width were measured weekly, and tumor volume was determined using the equation: L x W2 , where L is the longest side and W is the shortest side. Animals were euthanized at the study endpoint (21 days), and the tumors were excised for further experiments.
ELISA for Active NF-κB p65 Subunit
To measure NF-κB p65 subunit activation, nuclear extracts were prepared from 3 x 10⁶ tumor cells, using a Nuclear Extract Kit according to the manufacturer’s protocol. Levels of nuclear p65 concentrations were determined by a sensitive ELISA assay (TRANS-AM, Active Motif, Rixensart, Belgium).
TNF-α and NO Production
Tumors were macerated with RPMI and the supernatant collected and adjusted at a concentration of protein by BSA and stored at -20°C for evaluation. TNF-α was measured in the tumor supernatant by enzyme-linked immunosorbent assays (TNF alpha Mouse ELISA Kit; Invitrogen; Thermo Fisher Scientific; Viena, Austria). All assay procedures were performed according to the manufacturer’s protocol.
Nitrate/Nitrite assay kit was used to measure the levels of NO in the tissue homogenates of the tumor followed the protocol established by the manufacturer (Nitrate/Nitrite colorimetric assay kit; Cayman Chemical, USA).
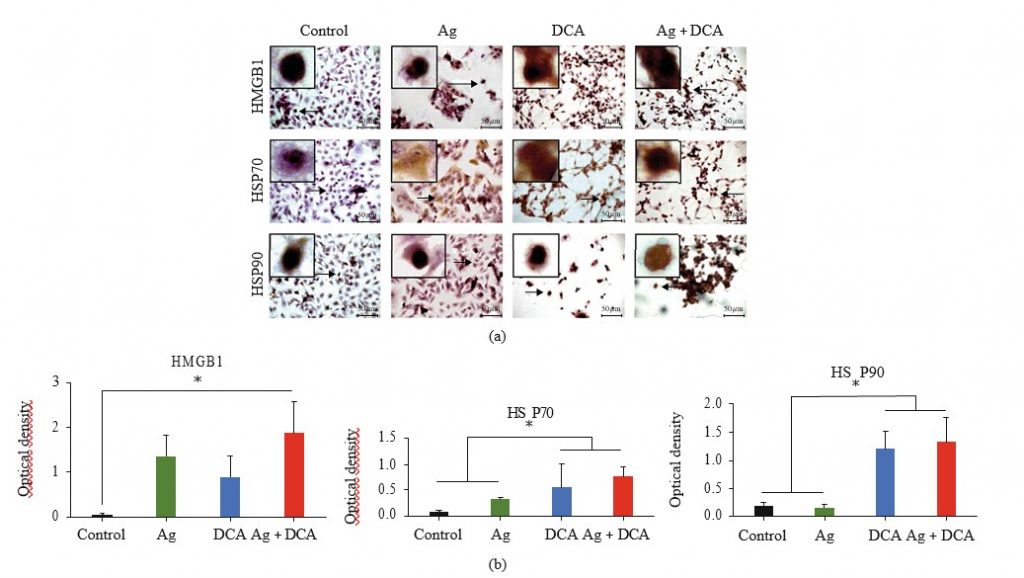
Immunocytochemistry for HMGB1, HSP70, and HSP90 Determination
Cells (100 x 103 cells/well) were seeded on glass cover slips at 37°C and 5% CO2 for 24 hours. After this, cells were treated with Ag LD50 (2.8 x 10⁻⁵ mM), DCA LD50 (195 mM), or Ag + DCA LD50 (2.8 x 10⁻⁵ mM and 135 mM, respectively) at 37°C and 5% CO2 for 4 hours. Subsequently, cells were fixed with methanol, blocked with normal horse serum (2.5%) (Vector Laboratories, ABC Kit) for 20 minutes, and incubated for 4 hours with Santa Cruz (Santa Cruz, CA, USA) mouse monoclonal antibodies against HMGB1(sc-56698), HSP70 (sc-24), or HSP90 (sc-7947), all used in a 1 : 1000 dilution. Then, cells were incubated with HRP-biotinylated anti-mouse/rabbit IgG (Vector Laboratories, ABC Kit) for 1 hour and Avidin-DH solution (Vector Laboratories, ABC Kit) for 30 minutes; DAB (3,3-diaminobenzidine) was added afterwards. DAB chromogen produces a brown reaction in the presence of peroxidase (HRP). Slides were counterstained with Mayer’s hematoxylin, dehydrated in an alcohol-xylol gradient, and mounted with Entellan® (synthetic resin) onto glass slides. Untreated B16F10 cells were used as HMGB1, HSP70, and HSP90 basal expression control. The HMGB1, HSP70, and HSP90 expression (DAB staining intensity) was performed using the Fiji (ImageJ) software version 2.0 as described by Patera (2019). Data are presented as DAB optical density (=log (max intensity/mean intensity)) of five sections per slide. Three independent experiments were performed.
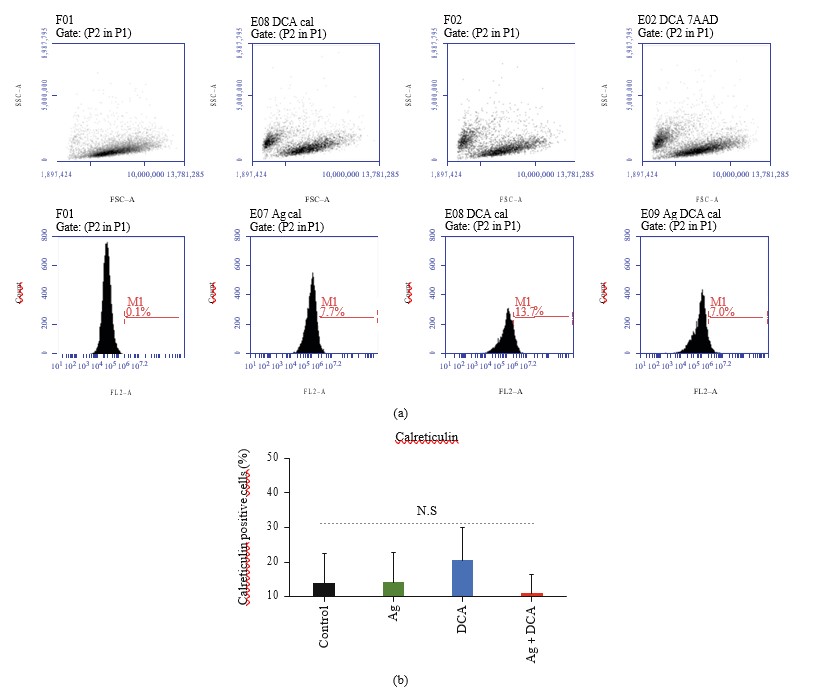
Flow Cytometry for Calreticulin Determination
Cells (50 x 103 cells/well) were seeded on ultra-low-attachment, 24-well plates at 37°C and 5% CO2. After this, cells were treated with Ag LD50 (2.8 x 10⁻⁵mM), DCA LD50 (195mM), or Ag + DCA LD50 (2.4 x 10⁻⁵ mM and 135 mM, respectively) at 37°C and 5% CO2 for 4 hours. Subsequently, cells were recovered and stained with calreticulin polyclonal antibody conjugated with phycoerythrin for 1 hour at 37°C and 5% CO2. Cells were washed with PBS+bovine serum albumin (BSA) (1% ) and resuspended in 200μl of PBS. Events were acquired in the Accouri C6 flow cytometer (BD Biosciences, San Jose, CA, USA).
In Vivo Antitumor Vaccination Experiments
For cell lysate preparation, we followed the protocol described by Rodríguez-Salazar et al. [12] with minor modifications. Briefly, B16F10 cells (5 x 10⁶) were treated in vitro with Ag (LD50) or DCA (LD50) or the Ag (LD25) + DCA (LD25) combination for 5h. Following this, the cells were centrifuged at 260 × g for 10min and washed twice with PBS. Finally, cells were resuspended in 200μl PBS and inoculated subcutaneously into the left flank of the mouse. After 7 days, mice were challenged with 5 x 10⁵ live B16F10 cells resuspended in 200 μl of PBS via subcutaneous injection into the right flank. Tumor incidence and growth were measured every day at the two injection sites for 30 days with a digital caliper. Tumor volume was calculated using the formula: V = (L x W2)/2, where V is the tumor volume, L is the tumor length, and W is the tumor width, same formula as previously used by Rodríguez-Salazar et al. [12].
Statistical Analysis
Statistical analysis was performed using a one-way analysis of variance (ANOVA) followed by Dunnett’s test, unless otherwise stated. Statistically significant difference was considered at . All experiments were performed in triplicate.
Results
DCA-Ag Decreased the Cellular Viability of Melanoma B16F10 Cells
The treatment of Ag or DCA induced a cell viability decrease of B16F10 cells in a dose-dependent manner when compared with the control (p < 0:01) (Figures 1(a) and 1(b)). DL25 (2.4 × 10⁵ mM) and DL50 (2.8 × 10⁵) were determined for Ag (Figure 1(a)); DL25 (135mM) and DL50 (195 mM) were also determined for DCA (Figure 1(b)). Lower doses of Ag and DCA were required in the combinatorial setting to achieve DL25 and DL50 (Figure 1(c)).
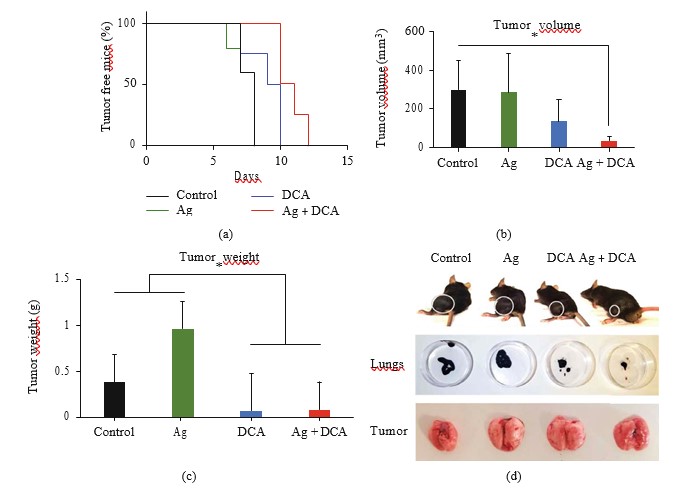
Ag-DCA Induced Tumor Regression
The administration of Ag, DCA, and Ag + DCA induced tumor volume regression (p < 0:05) in a time-dependent manner, observing a better effect in mice treated with Ag + DCA treatment (Figure 2(a)).
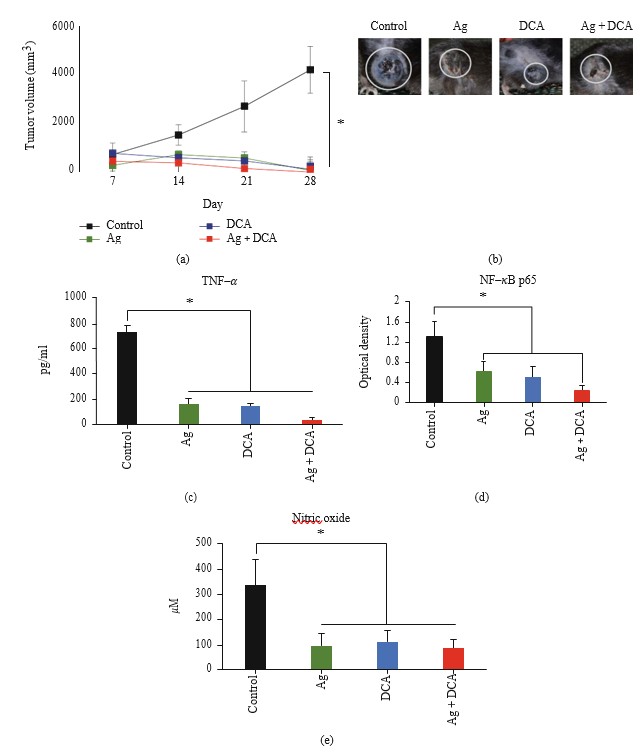
Ag, DCA, and Ag + DCA Treatments Decreased TNF-α, NF-κB, and Nitric Oxide
All treatments significantly decreased (p < 0:05) TNF-α production (Figure 2(c)), NFκB activity (Figure 2(d)), and nitric oxide (NO) production when compared to the control group; significant difference was not observed between treated groups (Figures 2(c)–2(e)).
HMGB1, HSP70, and HSP90 Expression and Localization in B16F10 Cells Treated with Ag, DCA, or Ag + DCA
HMGB1, HSP70, and HSP90 localization were determined by microscopy (Figure 3(a)). In control conditions, HMGB1, HSP70, and HSP90 were undetectable or localized to the nucleus (Figure 3(a)). Ag treatment mobilized HSP70 to the cytoplasm and cell membrane, DCA treatment mobilized HMGB1 and HSP70 to the cytoplasm and cell membrane, and AgDCA combined treatment mobilized HMGB1, HSP70, and HSP90 to the cytoplasm and cell membrane (Figure 3(a)). All treatments significantly increased (p < 0:05) HMGB1 and HSP70 expression; however, only DCA and Ag + DCA significantly increased (p < 0:05) HSP90, as compared to the control (untreated B16F10 cells) (Figure 3(b)).
Calreticulin Exposure in Ag, DCA, or Ag + DCA Treated Cells
Ag, DCA, and Ag + DCA treatments do not induce calreticulin surface exposure in B16F10 cells, as compared to the control (B16F10 untreated cells) (Figures 4(a) and 4(b)).
Ag, DCA, or Ag + DCA Do Not Induce Immunogenic Cell Death
B16F10 cells lysed with Ag, DCA, and AgDCA do not prevent tumor implantation in C57BL/6 mice (Figures 5(a)– 5(d)).
Discussion
The cytotoxic effect of colloidal silver (Ag), sodium dichloroacetate (DCA), and their combination was evaluated against B16F10 murine melanoma cells. Our results show that Ag has antiproliferative effects against B16F10 cells, as previously reported by our research group [13]. Further reports of the cytotoxic activity of silver against melanoma cells refer to silver nanoparticles, although the proposed toxicity mechanism remains the same [14]. DCA also exhibited an antiproliferative effect against melanoma cells. In a similar manner, Rivera-Lazarín et al. reported a dose-dependent viability decrease in B16F10 cells treated with DCA [15].
The cytotoxic activity of Ag and DCA increased when used as a combined treatment. This was expected since the combination of two or more agents is a cornerstone for cancer treatment; it allows to target key pathways simultaneously, achieving an efficacy increase [16].
After observing the increased cytotoxic effect, we evaluated whether our results correlated with an in vivo antitumor activity. At the tumor level, the generation of necrosis was noted; it is worth mentioning that the lesions completely healed in all cases of tumor elimination. Skin lesions can occur due to the overexpression of tumor necrosis factor alpha [17]. Our results revealed higher levels of TNF-α in untreated melanomas and a significant decrease of this factor in response to all of our treatments. TNF-α correlates with melanoma aggressiveness and metastatic potential in vivo [18], and its overexpression has been reported in advanced primary melanomas by Rossi et al. [19].
It is important to mention that TNF-α is a pleiotropic cytokine, and its proapoptotic effects against cancer cells have been widely described [20]; however, melanoma cells resist TNF-α–induced apoptosis through NF-κB and nitric oxide [21].
In this study, our results showed NF-κB and nitric oxide decrease in mice treated with Ag, DCA, or the combination of both, correlating with tumor regression. Wang et al. reported that NF-κB suppresses TNF-α–mediated apoptosis through the activation of the antiapoptotic proteins TRAF1, TRAF2, c-IAP1, and c-IAP2 [22]. On the other hand, Salvucci et al. reported nitric oxide production in human melanoma cells, and blocking this production induces cell death in human melanoma [23]. Specifically, nitric oxide inhibits at least seven caspases trough s-nitrosylation [24]
.
Despite our observations, it is important to mention that TNF-α, NF-κB, and NO have pleiotropic effects, and their role in melanoma is not well understood. However, we emphasize that our results indicate that these molecules decrease in correlation with tumor regression and wound healing.
Many anticancer therapies have the potential to induce cancer cell death, resulting in tumor elimination and a patient free of malignancy. However, only immunogenic cell death inducers can prevent cancer recurrence. Therefore, drugs that induce immunogenic cell death represent a recent innovation in the field of onco-immunotherapy [25], such is the case of the use of immunomodulator IMMUNEPOTENT CRP, that recently demonstrated this capacity [12]. We set out to evaluate whether our treatments were capable of inducing an immunogenic cell death.
The presence of alarmins in vitro indicates the potential to induce immunogenic cell death [26]. But, despite treatment-dependent increase of HMGB1, HSP70, and HSP90 (but not calreticulin), the vaccination of mice with B16F10 cells lysed with Ag, DCA, or the combination Ag + DCA did not induce immunogenic cell death as evidenced by the tumor appearance in all mice (vaccinated or unvaccinated) after challenge with viable B16F10 cells. Tumor growth indicates a specific immune response was not induced by the vaccines. A reason for this could be that DCA, Ag, and DCA + Ag do not induce the release of DAMPs in a coordinated spatiotemporal pattern; therefore, they lack the capacity to induce cytokines and efficient antigen presentation [27].
In conclusion, the combination of Ag and DCA has potential antitumor properties against melanoma cells; however, the in vivo antitumor mechanism is not immunogenic cell death. Further studies to elucidate the cell death mechanism are important in order to design strategies and combinations with clinical efficacy against melanoma.
Data Availability
Data associated with the manuscript is available upon reasonable request.
Conflicts of Interest
The authors declare that there is no conflict of interest.
Acknowledgments
This study was supported by “Fondo Sectorial de Investigación para la Educación” grant A1-S-35951, CONACYT, México. We thank MsC. Alejandra Arreola Triana for manuscript revision.
REFERENCES
1 D. B. Johnson and J. A. Sosman, “Update on the targeted therapy of melanoma,” Current Treatment Options in Oncology, vol. 14, no. 2, pp. 280–292, 2013.
2 E. A. Zaal and C. R. Berkers, “The influence of metabolism on drug response in cancer,” Frontiers in Oncology, vol. 8, p. 500, 2018.
3 Z.-F. Lim and P. C. Ma, “Emerging insights of tumor heterogeneity and drug resistance mechanisms in lung cancer targeted therapy,” Journal of Hematology & Oncology, vol. 12, no. 1, p. 134, 2019.
4 V. De Matteis, M. Cascione, C. Toma, and S. Leporatti, “Silver nanoparticles: synthetic routes, in vitro toxicity and theranostic applications for cancer disease,” Nanomaterials, vol. 8, no. 5, p. 319, 2018.
5 N. Durán, W. J. Fávaro, and A. B. Seabra, “What do we really know about nanotoxicology of silver nanoparticles in vivo? New aspects, possible mechanisms, and perspectives,” Current Nanoscience, vol. 16, no. 3, pp. 292–320, 2020.
6 M. Ahamed, M. S. AlSalhi, and M. K. J. Siddiqui, “Silver nanoparticle applications and human health,” Clinica Chimica Acta, vol. 411, no. 23–24, pp. 1841–1848, 2010.
7 K. Habiba, K. Aziz, K. Sanders et al., “Enhancing colorectal cancer radiation therapy efficacy using silver nanoprisms decorated with graphene as radiosensitizers,” Scientific Reports, vol. 9, no. 1, p. 17120, 2019.
8 T. Tataranni and C. Piccoli, “Dichloroacetate (DCA) and cancer: an overview towards clinical applications,” Oxidative Medicine and Cellular Longevity, vol. 2019, 14 pages, 2019.
9 S. Pustylnikov, F. Costabile, S. Beghi, and A. Facciabene, “Targeting mitochondria in cancer: current concepts and immunotherapy approaches,” Translational Research, vol. 202, pp. 35–51, 2018.
10 S. Grazioli and J. Pugin, “Mitochondrial damage-associated molecular patterns: from inflammatory signaling to human diseases,” Frontiers in Immunology, vol. 9, p. 832, 2018.
11 Y. Nie, D. Yang, and J. J. Oppenheim, “Alarmins and antitumor immunity,” Clinical Therapeutics, vol. 38, no. 5, pp. 1042–1053, 2016.
12 M. Rodríguez-Salazar, M. A. Franco-Molina, E. Mendoza-Gamboa et al., “The novel immunomodulator IMMUNEPOTENT CRP combined with chemotherapy agent increased the rate of immunogenic cell death and prevented melanoma growth,” Oncology Letters, vol. 14, no. 1, pp. 844–852, 2017.
13 C. A. Sierra Rivera, M. A. Franco Molina, E. Mendoza Gamboa, P. Zapata Benavides, R. S. Tamez Guerra, and C. Rodriacute guez Padilla, “Potential of colloidal or silver nanoparticles to reduce the growth of B16F10 melanoma tumors,” African Journal of Microbiology Research, vol. 7, no. 22, pp. 2745–2750, 2013.
14 L. M. Valenzuela-Salas, N. G. Girón-Vázquez, J. C. García-Ramos et al., “Antiproliferative and antitumour effect of nongenotoxic silver nanoparticles on melanoma models,” Oxidative Medicine and Cellular Longevity, vol. 2019, 12 pages, 2019.
15 A. L. R. LazarAAn, A. Zugasti Cruz, G A A.¡n. A. de la PeAAa, S. Y. S. Belmares, and C. A. Sierra Rivera, “Synergistic cytotoxic effect of sodium dichloroacetate combined with chemotherapeutic drugs on B16F10 murine melanoma cell line,” Biomedical Research, vol. 30, no. 1, 2019.
16 R. B. Mokhtari, T. S. Homayouni, N. Baluch et al., “Combination therapy in combating cancer,” Oncotarget, vol. 8, no. 23, pp. 38022–38043, 2017.
17 A. M. Brotas, J. M. T. Cunha, E. H. J. Lago, C. C. N. Machado, and S. C. S. Carneiro, “Tumor necrosis factor-alpha and the cytokine network in psoriasis,” Anais Brasileiros de Dermatologia, vol. 87, no. 5, pp. 673–683, 2012.
18 S. Moretti, C. Pinzi, A. Spallanzani et al., “Immunohistochemical evidence of cytokine networks during progression of human melanocytic lesions,” International Journal of Cancer, vol. 84, no. 2, pp. 160–168, 1999.
19 S. Rossi, M. Cordella, C. Tabolacci et al., “TNF-alpha and metalloproteases as key players in melanoma cells aggressiveness,” Journal of Experimental & Clinical Cancer Research, vol. 37, no. 1, p. 326, 2018.
20 A. Montfort, C. Colacios, T. Levade, N. Andrieu-Abadie, N. Meyer, and B. Ségui, “The TNF paradox in cancer progression and immunotherapy,” Frontiers in Immunology, vol. 10, p. 1818, 2019.
21 V. A. Soldatenkov, A. Dritschilo, Z. Ronai, and S. Y. Fuchs, “Inhibition of homologue of Slimb (HOS) function sensitizes human melanoma cells for apoptosis,” Cancer Research, vol. 59, no. 20, pp. 5085–5088, 1999.
22 C. Wang, M. W. Mayo, R. G. Korneluk, D. V. Goeddel, and Baldwin AS Jr, “NF-B antiapoptosis: induction of TRAF1 and TRAF2 and c-IAP1 and c-IAP2 to suppress caspase-8 activation,” Science, vol. 281, no. 5383, pp. 1680–1683, 1998.
23 O. Salvucci, M. Carsana, I. Bersani, G. Tragni, and A. Anichini, “Antiapoptotic role of endogenous nitric oxide in human melanoma cells,” Cancer Research, vol. 61, no. 1, pp. 318–326, 2001.
24 L. Rössig, B. Fichtlscherer, K. Breitschopf et al., “Nitric oxide inhibits caspase-3 by S -nitrosation in vivo,” The Journal of Biological Chemistry, vol. 274, no. 11, pp. 6823–6826, 1999.
25 B. Rapoport and R. Anderson, “Realizing the clinical potential of immunogenic cell death in cancer chemotherapy and radiotherapy,” International Journal of Molecular Sciences, vol. 20, no. 4, p. 959, 2019.
26 A. Terenzi, C. Pirker, B. K. Keppler, and W. Berger, “Anticancer metal drugs and immunogenic cell death,” Journal of Inorganic Biochemistry, vol. 165, pp. 71–79, 2016.
27 O. Kepp, L. Menger, E. Vacchelli et al., “Crosstalk between ER stress and immunogenic cell death,” Cytokine & Growth Factor Reviews, vol. 24, no. 4, pp. 311–318, 2013.